Fibonacci Retracements - A Precision Trading Strategy
Deciding on a topic for this article, I reviewed the top ranked articles in T2W and found some fantastic material. I did not however find inspiration for a new article idea that readers may like. Perhaps strangely, I then looked at the lowest rated articles. I noticed that two of them discussed Fibonacci which both surprised and intrigued me. It was not necessarily that people did not like Fib, just that perhaps it had not been explained well enough for their liking. I am a huge Fibonacci fan and it plays a big part in my trading so the following will explain how I use it to trade successfully.
While this strategy can be applied to almost any market, I will focus on the Dow Jones e-mini future, with all screenshots been the mini-Dow, (symbol YM) 1 minute charts.
Fibonacci - Is it really so subjective?
No! Not once you know how to use it correctly. There is a precise place where lines should be drawn and many places where they should not be drawn. I have seen them drawn in crazy places by people who claim that Fib does not work. There are also precise retracement levels that you should look to enter at, levels that you should use as a guide only and levels that will help you place stops.
What I am teaching is not from a book and it's not scientific (not that I know of anyway). It is simply the way that I have come to use Fibonacci retracements after many hours of screen time and it has added significantly to my trading ability after learning how to use it this way. I truly hope that it will assist you with your trading in a positive manner.
This article aims to dispel some of the myths surrounding Fib by showing how it can be used to trade the markets profitably & precisely, not subjectively as so many people seem to think.
You will learn:
What is a Fibonacci retracement?
After a move up or down in the market, at some point the market will start to "pull back" or "retrace". As the market starts to retrace, traders draw a Fibonacci line in the direction of the trend to see where the market might retrace too. This results in a series of lines drawn horizontally across the chart that the price may be supported or resisted at if price reaches them (See Figure 1). Common retracement levels are 38.2%, 50%, 61.8% and 78.6%. This means that after a move in either direction, equalling 100%, the retracements may be 38.2% or 50% or so on, back in the opposite direction of the 100% move. I.e. If the full move reversed then this would be a 100% retracement.
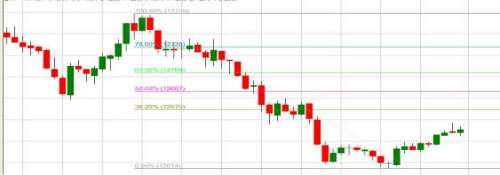
caption: Figure 1 - Fibonacci Retracement Ratios
The problem is that as the price retraces, there can be five or more retracement levels of possible support/resistance. How do you know which level the market is most likely to turn at? More importantly, where is a good place for you to enter a trade? The answer is you don't know yet; there is no high probability trade with only this amount of analysis.
This has led a lot of people to say that Fib is subjective and they argue the point valiantly. Well the truth is, it is subjective! But only for those people who don't have a precise strategy for how to use it. If you cannot pinpoint a trade with precision, i.e. the exact retracement level that you would like to buy or sell at, then you do not have a trading strategy. All you have is a very subjective and virtually useless (IMHO) trading tool.
So, lets cover how you can pinpoint the precise Fib retracement level that has the highest probability of the market turning. To understand the full trading strategy you must first understand trends at the basic level?
Trend Analysis
Simple trend analysis is perhaps the most straightforward, most important and yet most over-looked technical tool at our disposal. Time and time again I meet traders who skip over it because they think higher highs and higher lows it is "too simple". They think the advanced stuff (such as Fibonacci) is what will make them more money. This could not be further from the truth! Without a grasp of the basics, the advanced stuff never quite makes sense either. Correct trend analysis is, in my opinion, the most important thing that a trader can ever understand. It is also necessary for drawing Fib lines correctly (no wonder so many people think Fib is subjective when so many don't yet understand trends).
An uptrend is:
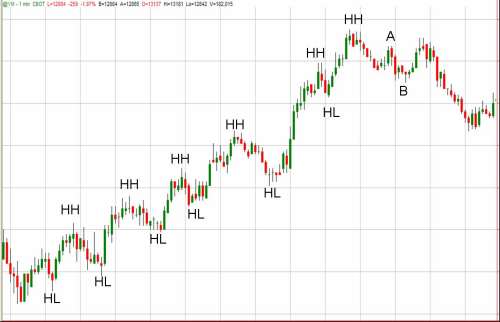
caption: Figure 2 - Uptrend
A downtrend is:
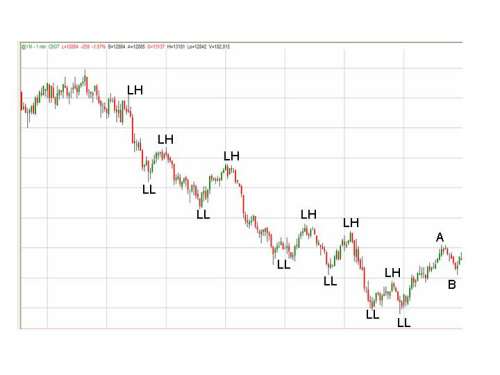
caption: Figure 3 - Downtrend
Where the Fib line should Start from
Firstly, you should only draw a Fib retracement level when there is a trend. All trends have to retrace in order for the above definitions to be true i.e. in an uptrend price has to pullback from a HH to make a HL. You are always looking for a retracement of the current trend which ensures you have momentum behind the move. If there is no clear trend then by using Fib retracements you are swimming against the tide even before you even begin. Fib does not work in ranging markets! The nature of a ranging market is that it will range between two levels, hence pulling back around 100% of each prior move.
Now that you are trading with the trend, you should start your Fib line from a HL within an uptrend or a LH within a downtrend. Refer back to Figure 2. Each HL was a possible start point for your Fib line. You should draw it upwards in the direction of the trend. Equally, in Figure 3, each LH was a place to start a line from and draw downward in the direction of the trend.
The most important place to start from is:
Remember the above points as they are the most crucial steps in applying Fib correctly. This will ensure that you are only looking for retracements of the current trend in the timeframe you are trading. For example, look at figure 3. We have now reversed the downtrend and are uptrending (made a HH & HL) so there is no point drawing a Fib line downwards any longer. In fact, if you were to draw a line on this chart right now, the only place to do it would be with the uptrend from the last LL up to point A.
Where the Fib line should End
This is the part where people most often get it wrong. There are highs and lows all over the chart so which one do you use? The answer is in fact very simple: The line should always end at the extreme i.e.:
Hence, if there is no trend there is no Fib retracement to be drawn. Also, once a new high or low has been made (a new extreme) new fib lines need to be redrawn, your old ones are now completely invalidated as you would no longer be looking at a retracement of the current trend. Look at Figure 4 for an example. You MUST draw your fib line as shown from point D (the most recent high) down to point E (the most recent low or the extreme). There is no point drawing a line from C down to X2 any longer. X2 was a valid low when it was the extreme, however now a new low has been made at E and this is the ONLY point where Fib Lines should end.
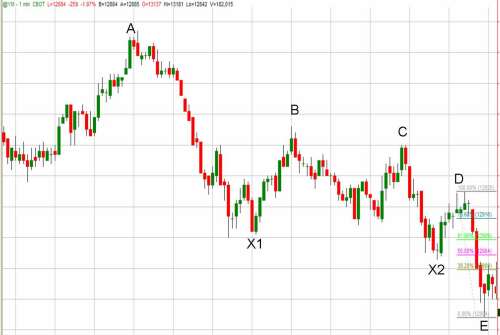
caption: Figure 4
To confirm:
To confirm: Short term move
Long term move
All Fib lines must "end" at the same point, you can however "start" from different points, drawing to the same end point. This is what I will refer to as the long-term move. This is how we locate clusters and is also how we start to build a high probability entry point?
Locating clusters of Support and resistance
Again looking at Figure 4, we know that the line has to be drawn from D down to E as this makes sure we are only trading a pullback of the current trend. This however leaves us with four potential retracement levels. To define a potential entry point, we must look to see if any Fib retracements cluster at the same level. To do this, you must use a different start point for your Fib line and finish at the same end point. See Figure 5 which shows the same chart as Figure 4, however this time we are drawing a second Fib line from a different start point, C, and finishing at the same end point, E. Note that the 38.2% for the larger move down (C to E) overlaps with the 50% of the short term move (D to E). This is what is referred to as a Fib cluster and become a much higher probability turning point if the price reaches there.
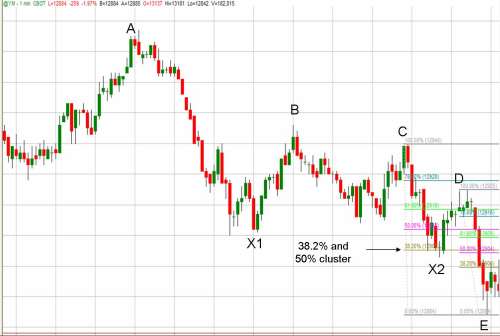
caption: Figure 5
The same is very true in an uptrend. Refer to figure 6 which shows a cluster of the short term 50% and longer term 38.2%. See figure 7 to see what happened when this level was tested.
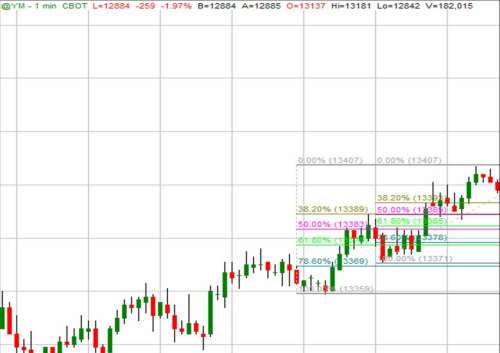
caption: Figure 6
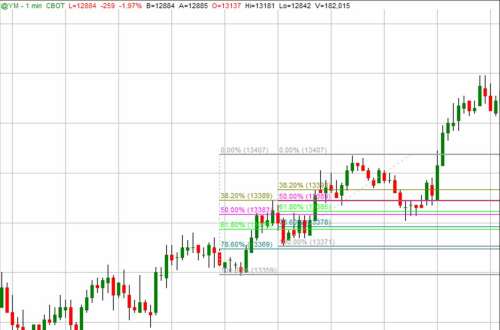
caption: Figure 7
The retracement levels and their correct usage
While there are many more Fibonacci retracement levels, the ones that you should use are as follows:
38.2%
By nature of the fact that we are looking for clusters for an entry point, the 38.2% will only be used for the long-term move. E.g. a 38.2% move for the longer term may cluster with the shorter term 50% or 61.8% level.
50%
The buy zone - look to buy 50% pullbacks of the short term move when there is a cluster of support/resistance at the same level. Granted, 50% is not actually a Fib number to the best of my knowledge. However it works well and it works often. 50% represents the point of equilibrium between buyers and sellers within a trend.
61.8%
The buy Zone - as with the 50% level, you should look to buy 61.8% pullbacks of the short term move but only when this level clusters with other support/resistance at the same point. 61.8% is known as "The Golden Ratio" and is perhaps the most powerful of all Fib retracement levels.
78.6%
This level should not be used for entry. Rather your stop loss should be placed behind the short term 78.6% retracement level. The reason for this is that the further the price pulls back, the higher the probability that it is actually a reversal as compared to a retracement. Once the price pulls back over 78.6% there is a far higher probability that it will actually retrace the full 100%. Hence, a stop behind 78.6% protects your losses by having a slightly tighter stop that using the 100% level. This also results in a more favourable reward to risk ratio.
100%
This means that the full move has reversed. Use this for stops only in a situation where you would like a slightly wider stop than the 78.6% or where the 100% adds significantly to the probability of your trade. E.g. It is a major support level.
Note that we do not use the 23.6% pullback, this is simply too small a pullback for a high probability entry point.
Trading Strategy
I use one minute charts on the mini Dow future (YM) as the short term trends are clearer but it does not really matter what you use. For example I trade the same strategy on Forex with 15m charts and regularly analyse daily charts across a range of markets using the same technique. Another reason I prefer the 1m chart on the Dow is that I predominantly trade the US open from 2:30pm GMT. While you may of course look at 2, 5 or 15 minute charts, the trends will be less clear and take longer to develop once the market opens. A 1m trend becomes clear very quickly and thus suits my timeframes.
Entry
Enter at the precise point of the cluster i.e. as the price touches it. Not before and not after. Only ever trade with the direction of the overall trend.
Your confirmation is the fact that you have a strong cluster within a strong trend. Do not wait for the price to turn around at this level, by then it is too late. If you wait for the price to do what you thought it would then you have missed the trade. We are using leading indicators here to predict the move in advance.
Stop
Your stop should be placed behind the 78.6% retracement level. More conservative traders could place their stop just behind the 100% level but do not have a stop any wider than this.
Target
Your target is the old high/low or the 0% retracement level. I.e., you expect the price to retest the extreme.
A further profit target for those who prefer to scale out of trades is to use Fibonacci extension levels.
Improvements
Other technical factors to consider:
Trend Improvements
Cluster Improvements
There are various ways to improve upon the success of this strategy even further. There are thousands of technical tools out there and we can't use them all but if you have something that is working for you, keep on using it. The Precision Trader philosophy is quite simple - "Have as many reasons as you possibly can for every single trade that you place". The more reasons you have occurring all at the same time, the higher the probability of the trade been a success. At the end of the day that is all you need? the confidence in your strategy that you have more chance of winning than losing. And of course the ability to execute precisely according to your rules. Happy trading and best of luck for a very prosperous 2008!
Deciding on a topic for this article, I reviewed the top ranked articles in T2W and found some fantastic material. I did not however find inspiration for a new article idea that readers may like. Perhaps strangely, I then looked at the lowest rated articles. I noticed that two of them discussed Fibonacci which both surprised and intrigued me. It was not necessarily that people did not like Fib, just that perhaps it had not been explained well enough for their liking. I am a huge Fibonacci fan and it plays a big part in my trading so the following will explain how I use it to trade successfully.
While this strategy can be applied to almost any market, I will focus on the Dow Jones e-mini future, with all screenshots been the mini-Dow, (symbol YM) 1 minute charts.
Fibonacci - Is it really so subjective?
No! Not once you know how to use it correctly. There is a precise place where lines should be drawn and many places where they should not be drawn. I have seen them drawn in crazy places by people who claim that Fib does not work. There are also precise retracement levels that you should look to enter at, levels that you should use as a guide only and levels that will help you place stops.
What I am teaching is not from a book and it's not scientific (not that I know of anyway). It is simply the way that I have come to use Fibonacci retracements after many hours of screen time and it has added significantly to my trading ability after learning how to use it this way. I truly hope that it will assist you with your trading in a positive manner.
This article aims to dispel some of the myths surrounding Fib by showing how it can be used to trade the markets profitably & precisely, not subjectively as so many people seem to think.
You will learn:
- How fib is used objectively every time we draw a line
- Exactly where to draw lines from (Start point)
- Exactly where to draw lines too (End point)
- Which of the Fibonacci retracement levels should be used as entry points and which should be used as guide to direction only or a stop loss
- A trading strategy with precise entry, stop loss and targets
What is a Fibonacci retracement?
After a move up or down in the market, at some point the market will start to "pull back" or "retrace". As the market starts to retrace, traders draw a Fibonacci line in the direction of the trend to see where the market might retrace too. This results in a series of lines drawn horizontally across the chart that the price may be supported or resisted at if price reaches them (See Figure 1). Common retracement levels are 38.2%, 50%, 61.8% and 78.6%. This means that after a move in either direction, equalling 100%, the retracements may be 38.2% or 50% or so on, back in the opposite direction of the 100% move. I.e. If the full move reversed then this would be a 100% retracement.
caption: Figure 1 - Fibonacci Retracement Ratios
The problem is that as the price retraces, there can be five or more retracement levels of possible support/resistance. How do you know which level the market is most likely to turn at? More importantly, where is a good place for you to enter a trade? The answer is you don't know yet; there is no high probability trade with only this amount of analysis.
This has led a lot of people to say that Fib is subjective and they argue the point valiantly. Well the truth is, it is subjective! But only for those people who don't have a precise strategy for how to use it. If you cannot pinpoint a trade with precision, i.e. the exact retracement level that you would like to buy or sell at, then you do not have a trading strategy. All you have is a very subjective and virtually useless (IMHO) trading tool.
So, lets cover how you can pinpoint the precise Fib retracement level that has the highest probability of the market turning. To understand the full trading strategy you must first understand trends at the basic level?
Trend Analysis
Simple trend analysis is perhaps the most straightforward, most important and yet most over-looked technical tool at our disposal. Time and time again I meet traders who skip over it because they think higher highs and higher lows it is "too simple". They think the advanced stuff (such as Fibonacci) is what will make them more money. This could not be further from the truth! Without a grasp of the basics, the advanced stuff never quite makes sense either. Correct trend analysis is, in my opinion, the most important thing that a trader can ever understand. It is also necessary for drawing Fib lines correctly (no wonder so many people think Fib is subjective when so many don't yet understand trends).
An uptrend is:
- A series of higher highs (HH) and higher lows (HL). See Figure 2.
An uptrend is over when this trend reverses. I.e. The price makes either a:- Lower high (Figure 2 Point A) and/or;
- Lower Low (Figure 2 point B)
- Lower high (Figure 2 Point A) and/or;
caption: Figure 2 - Uptrend
A downtrend is:
- A series of lower lows (LL) and lower highs (LH). See Figure 3.
A downtrend is over when this trend reverses. I.e. The price makes either a:- Higher High (Figure 3 Point A) and/or;
- Higher Low (Figure 3 point B)
- Higher High (Figure 3 Point A) and/or;
caption: Figure 3 - Downtrend
Where the Fib line should Start from
Firstly, you should only draw a Fib retracement level when there is a trend. All trends have to retrace in order for the above definitions to be true i.e. in an uptrend price has to pullback from a HH to make a HL. You are always looking for a retracement of the current trend which ensures you have momentum behind the move. If there is no clear trend then by using Fib retracements you are swimming against the tide even before you even begin. Fib does not work in ranging markets! The nature of a ranging market is that it will range between two levels, hence pulling back around 100% of each prior move.
Now that you are trading with the trend, you should start your Fib line from a HL within an uptrend or a LH within a downtrend. Refer back to Figure 2. Each HL was a possible start point for your Fib line. You should draw it upwards in the direction of the trend. Equally, in Figure 3, each LH was a place to start a line from and draw downward in the direction of the trend.
The most important place to start from is:
- The most recent low within a current up-trend.
- The most recent high within a current down-trend
Remember the above points as they are the most crucial steps in applying Fib correctly. This will ensure that you are only looking for retracements of the current trend in the timeframe you are trading. For example, look at figure 3. We have now reversed the downtrend and are uptrending (made a HH & HL) so there is no point drawing a Fib line downwards any longer. In fact, if you were to draw a line on this chart right now, the only place to do it would be with the uptrend from the last LL up to point A.
Where the Fib line should End
This is the part where people most often get it wrong. There are highs and lows all over the chart so which one do you use? The answer is in fact very simple: The line should always end at the extreme i.e.:
- The most recent HH within an uptrend or;
- The most recent LL within a downtrend
Hence, if there is no trend there is no Fib retracement to be drawn. Also, once a new high or low has been made (a new extreme) new fib lines need to be redrawn, your old ones are now completely invalidated as you would no longer be looking at a retracement of the current trend. Look at Figure 4 for an example. You MUST draw your fib line as shown from point D (the most recent high) down to point E (the most recent low or the extreme). There is no point drawing a line from C down to X2 any longer. X2 was a valid low when it was the extreme, however now a new low has been made at E and this is the ONLY point where Fib Lines should end.
caption: Figure 4
To confirm:
To confirm: Short term move
- Within an UP trend, you MUST always draw your Fib line starting from the most recent low and finishing at the most recent high
- Within a DOWN trend, you MUST always draw your Fib line starting from the most recent high and finishing at the most recent low
- Both of the above are what I refer to as the "Short-term Move"
Long term move
All Fib lines must "end" at the same point, you can however "start" from different points, drawing to the same end point. This is what I will refer to as the long-term move. This is how we locate clusters and is also how we start to build a high probability entry point?
Locating clusters of Support and resistance
Again looking at Figure 4, we know that the line has to be drawn from D down to E as this makes sure we are only trading a pullback of the current trend. This however leaves us with four potential retracement levels. To define a potential entry point, we must look to see if any Fib retracements cluster at the same level. To do this, you must use a different start point for your Fib line and finish at the same end point. See Figure 5 which shows the same chart as Figure 4, however this time we are drawing a second Fib line from a different start point, C, and finishing at the same end point, E. Note that the 38.2% for the larger move down (C to E) overlaps with the 50% of the short term move (D to E). This is what is referred to as a Fib cluster and become a much higher probability turning point if the price reaches there.
caption: Figure 5
The same is very true in an uptrend. Refer to figure 6 which shows a cluster of the short term 50% and longer term 38.2%. See figure 7 to see what happened when this level was tested.
caption: Figure 6
caption: Figure 7
The retracement levels and their correct usage
While there are many more Fibonacci retracement levels, the ones that you should use are as follows:
38.2%
By nature of the fact that we are looking for clusters for an entry point, the 38.2% will only be used for the long-term move. E.g. a 38.2% move for the longer term may cluster with the shorter term 50% or 61.8% level.
50%
The buy zone - look to buy 50% pullbacks of the short term move when there is a cluster of support/resistance at the same level. Granted, 50% is not actually a Fib number to the best of my knowledge. However it works well and it works often. 50% represents the point of equilibrium between buyers and sellers within a trend.
61.8%
The buy Zone - as with the 50% level, you should look to buy 61.8% pullbacks of the short term move but only when this level clusters with other support/resistance at the same point. 61.8% is known as "The Golden Ratio" and is perhaps the most powerful of all Fib retracement levels.
78.6%
This level should not be used for entry. Rather your stop loss should be placed behind the short term 78.6% retracement level. The reason for this is that the further the price pulls back, the higher the probability that it is actually a reversal as compared to a retracement. Once the price pulls back over 78.6% there is a far higher probability that it will actually retrace the full 100%. Hence, a stop behind 78.6% protects your losses by having a slightly tighter stop that using the 100% level. This also results in a more favourable reward to risk ratio.
100%
This means that the full move has reversed. Use this for stops only in a situation where you would like a slightly wider stop than the 78.6% or where the 100% adds significantly to the probability of your trade. E.g. It is a major support level.
Note that we do not use the 23.6% pullback, this is simply too small a pullback for a high probability entry point.
Trading Strategy
I use one minute charts on the mini Dow future (YM) as the short term trends are clearer but it does not really matter what you use. For example I trade the same strategy on Forex with 15m charts and regularly analyse daily charts across a range of markets using the same technique. Another reason I prefer the 1m chart on the Dow is that I predominantly trade the US open from 2:30pm GMT. While you may of course look at 2, 5 or 15 minute charts, the trends will be less clear and take longer to develop once the market opens. A 1m trend becomes clear very quickly and thus suits my timeframes.
Entry
Enter at the precise point of the cluster i.e. as the price touches it. Not before and not after. Only ever trade with the direction of the overall trend.
Your confirmation is the fact that you have a strong cluster within a strong trend. Do not wait for the price to turn around at this level, by then it is too late. If you wait for the price to do what you thought it would then you have missed the trade. We are using leading indicators here to predict the move in advance.
Stop
Your stop should be placed behind the 78.6% retracement level. More conservative traders could place their stop just behind the 100% level but do not have a stop any wider than this.
Target
Your target is the old high/low or the 0% retracement level. I.e., you expect the price to retest the extreme.
A further profit target for those who prefer to scale out of trades is to use Fibonacci extension levels.
Improvements
Other technical factors to consider:
Trend Improvements
- Look for convergence and divergence between price action and indicators to assess trend strength
- Use trend following indicators such as the ADX or DMI
- Assess trends in multiple timeframes
Cluster Improvements
- Look for proven price action support and resistance at the same levels i.e. price has tested and failed at that level before
- Pivot points - a topic for another article perhaps. In my opinion pivots are the most powerful, individual technical tool at our disposal. Find a pivot at the same point as your Fib cluster and you have a VERY high probability trade. This forms the basis of what I call my Precision Trading Strategy. It also happens far more often than you may think.
There are various ways to improve upon the success of this strategy even further. There are thousands of technical tools out there and we can't use them all but if you have something that is working for you, keep on using it. The Precision Trader philosophy is quite simple - "Have as many reasons as you possibly can for every single trade that you place". The more reasons you have occurring all at the same time, the higher the probability of the trade been a success. At the end of the day that is all you need? the confidence in your strategy that you have more chance of winning than losing. And of course the ability to execute precisely according to your rules. Happy trading and best of luck for a very prosperous 2008!
Last edited by a moderator: