When does a Trendline fail? How much leeway do you give it?
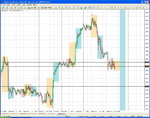
todays EURJPY chart on the 1-mins.
The down Trendline(D-TL) as starting point.
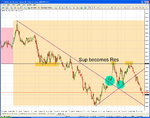
The Sup becoming Res was quite clear today, with clear congestion, and break to the downside.
However, how much do you allow the TL to be breached before declaring it void?
sometimes TLs will breach, congest, and fail, which I can see.
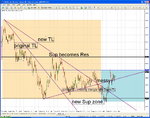
But in todays example, the first breach (first aqua circle) could have tumbled back, but didnt.
Although the Sup-to-Res held, it didnt fall far enough back. (second aqua circle).
in my mind, the D-TL is under threat, and a possible Up TL may become valid.
In reality, a third bounce off Res has taken it down.
But, how much leeway do you give to a TL to return to its main direction?
(I understand its down to levels of sensitivity, much like what your indicator settings are, but we have all experienced TLs being breached/spiked, only to return, and we dont think the TL is under threat)
Discuss.