FTSE100 - January 2005

bracke

Experienced member
Messages
1,286
Likes
12
Fellow Posters & Viewers

Thought I better open up the new thread whilst the rest of you are still in stupor mode.

I would like to take this opportunity to wish our myriad readers a successful trading year but knowing fullwell that some must lose in order that others may win. I asked Santa if I could be on the winning side this year and he said yes, so please bear that in mind.

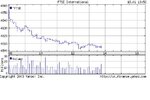
The FTSE opened 2004 at 4477 and closed at 4814 - a rise of 337 = 7.53%.

Forecast for 2005. Not a clue.

Regards & A Happy New Year

bracke
 
Happy New Year everyone. May your plans prosper, your rules reward and your accounts accumulate.

2005? Well, the monthly still looks bullish, albeit second phase trend, with fib 50% hoving into view.

The weekly looks fairly strong too, the mid point of the last long white held as support although the previous didn't and had to rely on support at it's base (which should be the stronger). Will mid point or base hold for the latest one? The last three candles give something of a stalled pattern which may give a bit of down to test those supports next week.

The daily finished a bit indecisive/weak after the boys had persuaded santa to rally up their bonuses. No volume, of course, so we await the next session with bated breath.

good trading all - stick to your New Year resolutions

jon
 

Attachments

  • ftseM.gif
    ftseM.gif
    10.1 KB · Views: 414
  • ftseW.gif
    ftseW.gif
    8.6 KB · Views: 384
  • ftse.gif
    ftse.gif
    12.2 KB · Views: 385
To me it looks like the indices will start going really down from early to mid Jan.
Don't ask me how I know that!... and yes I'm new to this :)
 
karmit said:
To me it looks like the indices will start going really down from early to mid Jan.
Don't ask me how I know that!... and yes I'm new to this :)

Karmit

Not wishing to be nasty ( I have to say that as I am sometimes misconstrued - I am getting treatment ) but if you are trading or intending to trade on the basis of the above quote you are heading for trouble.

You may be correct but if you trade purely on the basis of 'feel' or 'looks' without some logic you will come unstuck.

If you have not already done so I suggest you look at the threads for those new to trading.

Good fortune and welcome to the thread.

Regards

bracke
 
heck no! Bracke! - I value good advice :)
Do you have in mind some basic s/w service which every rookie should use?
I normally check yahoo finance... but I'm looking for something better... better real-time charts / analysis
etc. If it requires a small (I mean small!) subscription fee - might consider it as well.
cheers,
karmit
 
karmit said:
heck no! Bracke! - I value good advice :)
Do you have in mind some basic s/w service which every rookie should use?
I normally check yahoo finance... but I'm looking for something better... better real-time charts / analysis
etc. If it requires a small (I mean small!) subscription fee - might consider it as well.
cheers,
karmit

Not a software site but the need to accumulate knowledge. Suggest that you look at the First Steps thread and the new knowledge lab on this site.

The free charts on www.advfn.co.uk are useful.

Suggest that you get a basic understanding of trading before you subscribe for charts or analysis.

Don't be in too much of a hurry to start trading for real. Start acquiring the knowledge and decide on the type of trading that interest/suits you.

Trade in haste, repent at leisure.

Regards

bracke
 
hmm.. the DOW sure seems to be going down... maybe till the Friday report comes, this would be the
trend?
 
karmit said:
hmm.. the DOW sure seems to be going down... maybe till the Friday report comes, this would be the
trend?

There was a good opportunity to go short after the opening gap and subsequent rise. This comment based on probability of gap closure plus fast rise is usually followed by fast fall. I do not follow the dow very closely but would also be looking at price in relation to resistance level.

As to trend that depends on the timeframe you are looking at.

Regards

bracke
 
happy new year all :)

just noticed from todays trading and all that the graph above seems to point very heavily to a double top at the 42824 mark between now and nov 15th 04.
 
evenin' all

Not a pretty sight for the bulls. If you blend the last two candles you get a bearish shooting star type candle with an upper shadow twice as long as the real body. Will the first support ditch (yellow area) hold - if not that'll be strike two for the bears.

Still the action's given me five potential long entries if they surprise by moving north tomorrow.

good trading

jon
 

Attachments

  • ftsew.gif
    ftsew.gif
    12.2 KB · Views: 355
Has the interest in this thread receded a bit? Can not make out FTSE broke 4850, broke 4800 (oodwnards) went up above 4800 and back down velow 4800. Not an expert (still learning) but I think FTSE may be heading towards 4730 levels.
Any views?
 
gullible said:
Has the interest in this thread receded a bit? Can not make out FTSE broke 4850, broke 4800 (oodwnards) went up above 4800 and back down velow 4800. Not an expert (still learning) but I think FTSE may be heading towards 4730 levels.
Any views?

Unfortunately I think it has. We lost a number of our main contributors during the course of last year.

I cannot comment on your thought that ftse may be heading to 4730. It seems to me that the weighted nature of the ftse100 makes it a difficult indices to trade but I have no doubt that others would disagree.

Perhaps we might get a few comments, opinions and views on your thought.

Regards

bracke
 
Hi guys

Despite gullible's prompt things have been dead as a dodo on the thread. No-one trading ftse anymore? Just no interest? Beary boys retired hurt? Or what?

Anyway, how did the week pan out. The retreat was held by a resistance becomes support line; fib50% of the 9/12 to 7/1 up move; the mid-point of the last long weekly candle; any reason that takes your fancy; or no good reason whatsoever. :LOL:

Thurday's harami gave a better than evens chance of an up move on Friday and that came on the highest volume of the week, albeit not markedly high. Can't see much to encourage the downside at the moment, but you never know. I'm still favouring longs 'til I see something to persuade me otherwise.

Good trading all.

jon
 

Attachments

  • ftse.gif
    ftse.gif
    13.4 KB · Views: 272
  • ftsew.gif
    ftsew.gif
    8.6 KB · Views: 271
barjon said:
Hi guys

Despite gullible's prompt things have been dead as a dodo on the thread. No-one trading ftse anymore? Just no interest? Beary boys retired hurt? Or what?

Anyway, how did the week pan out. The retreat was held by a resistance becomes support line; fib50% of the 9/12 to 7/1 up move; the mid-point of the last long weekly candle; any reason that takes your fancy; or no good reason whatsoever. :LOL:

Thurday's harami gave a better than evens chance of an up move on Friday and that came on the highest volume of the week, albeit not markedly high. Can't see much to encourage the downside at the moment, but you never know. I'm still favouring longs 'til I see something to persuade me otherwise.

Good trading all.

jon

On your 1 day chart you show a number of lines with readings, would you mind informing us what they are?

And for those not aware of mid-candle s/r, a mention of your not to be missed thread might be worth a mention.

Regards

bracke
 
Thank you all. FTSE appears to going up now? do not know why I am saying this but having fallen to 4770 after hours on Thrusday, it went abck up to 4828 yesterday. These levels are from CFD prices at D4free
 
bracke

They're the Fibonacci retracement levels. The fib50% is 4769.

gullible

Widening the timescale a bit, the uptrend looks fairly sound but we'll need to go on to new highs to confirm it. Attached a line chart for a different perspective (before you ask, bracke, the red and blue lines are 60 and 100 simple moving averages - I don't use them myself but just stuck them in for added interest :) )

jon
 

Attachments

  • ftsema.gif
    ftsema.gif
    11.6 KB · Views: 263
Barjon,

Thankyou, quite ineteresting. See what you mean. For short term trading I do use 20 and 40 period SMA and MACD on the same graph. D4F charts do not have volumes. The only thing is that FTSE more often than not follows Dow. Dow of latley cannot seems more downwards than upwards.
We shall see what happens next week. Monday pobably will be non event as US markets are closed. May be Wednesday, shall get out of my short positions @4812
 
FTSE is harder to trade than DAX or SPX yet I suppose we are comfortable with it I had recently been given back the book Trading Rules by a bloke called Eng-one simple rule that has helped me-Is this a trending market or atrading market-the latter being one that rattles around in a channel with fairly clear support and resistance.I think FWIW that the FTSE has come out of trending and will be trading for a while.US shut on monday,so maybe quiet until Wednesday-a whole wadge of updates from the US to move the indexes.Happy trading
 
ftse down to 4800ish. Next support at 4775 and then 4690 so would appear to be reasonable chance of limited downside.

Lowest close this year 4784, what chance of a rise today/tomorrow provided the US does not fall?

Regards

bracke
 

Attachments

  • untitled.jpg
    untitled.jpg
    29.2 KB · Views: 222
bracke said:
ftse down to 4800ish. Next support at 4775 and then 4690 so would appear to be reasonable chance of limited downside.

Lowest close this year 4784, what chance of a rise today/tomorrow provided the US does not fall?

Regards

bracke

mmm, fwiw my fingers poised on the buy button and watching to see if the infamous 10am reversal on the dow takes effect.
 
Top