barjon
Legendary member
- Messages
- 10,752
- Likes
- 1,863
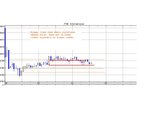
knucklehead said:The trend changed on 3rd January 2005 with all that energy sector selling!
Huge sell day for the dow was 17dec04, nasdaq needs only 4/5 higher volume sell days to change the trend !
Look out below 🙂
knucklehead
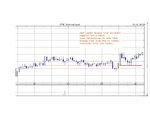
3rd January? Wasn't the market closed.
jon