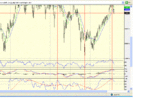
FTSE 100 - March

bonsai

Veteren member
Messages
4,106
Likes
11
February is always a miserable month, I think and glad to be rid of it.

No progress on FTSE but no sell off either.

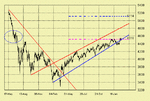
Starting with the channel chart again as it seems to be back in play although the channel lines are no longer picking off support and resistance.

The resistance to the left of the chart seems to be the problem from a chart point of view.

But the fib at 4357 held up well and makes the 4400 area look full of support.

Momentum is obviously weakening and it may take a new high on the Dow to help push us up and through.
 

Attachments

  • channel.gif
    channel.gif
    9.4 KB · Views: 1,170
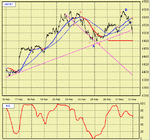
here is my chart as of friday with a possible wave count.

I suspect we have seen the B wave that finerama alluded to although I wouldn't like to guess how deep the C wave might be in view of strong support at 4357,4400 and 4478.

But as we only just scraped to a new high on friday if C=A then expect some reaction around 4480

One other possibility you should consider is that we have only just completed 5 waves from 4357 on friday. In which case, we have only now started the correction and what we saw on friday may be the A wave in action.

March, they say, comes in like a lion !!!
 

Attachments

  • feb.gif
    feb.gif
    15 KB · Views: 1,205
Last edited:
ahhh here you are LOL...Just posted on the other thread :)

Morning
 
:LOL:

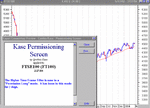
is this of any value to anybody ?
 

Attachments

  • kase.gif
    kase.gif
    36.3 KB · Views: 1,177
"the Kase Permission Stochastic computes a synthetic higher time frame stochastic, which is based on a moving higher time frame window that ends with each bar. "
 
where did you get it from??/ What I found on a search was that it just looks like a slow..slow stochastic.
 
goostrey
to be honest, I don't use them or it.
but after Hooya started posting squares and things it reminded me that I had a copy gathering dust on the shelf.
so I just loaded it it for fun.

It is end of day of course so has little relevance today trading.
 
ahh metastock...was that what you used to use to trade before you wrote your own program?
 
no

over the years I have bought a variety of software packages but not found anything with any real added value.

Millions of indicators which you don't need. (or don't understand)

But you have to take a look,don't you.?
 
It's like travel ? it broadens the mind.
that's expensive too.

but helps you to keep an open mind !
 
what I liked at the time with Metastock was the ability to write your own indicators and have visual alerts.

so I picked their brains and put the alerts feature in my own software.

also setting trend lines at specific 'angles'
 
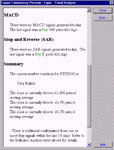
true...as long as you can take something from it...its worth it. Like I spent the weekend...well all day Sunday......going over stuff I had found on the web and I probably only took 1 part of it which I thought was of value.
 

Attachments

  • 500day thingy.gif
    500day thingy.gif
    124.7 KB · Views: 384
Last edited:
Bonsai.
Can you please tell me what period ma's are you using on the above chart 16th Feb to the 1st Mar and also the rsi.Have taken a copy of this for my TA ref.
Many thanks.
 
Top