You are using an out of date browser. It may not display this or other websites correctly.
You should upgrade or use an alternative browser.
You should upgrade or use an alternative browser.
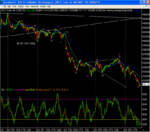
because I have been away. I havent been posting any charts
and this one is too late to be of much use.
But, to emphasise the importance of rising wedges/triangles and
their apex points, here is what I saw a few days ago.
(One for the scrap book)
As you can see, the weak rally completely failed at the apex
of the triangle.
and this one is too late to be of much use.
But, to emphasise the importance of rising wedges/triangles and
their apex points, here is what I saw a few days ago.
(One for the scrap book)
As you can see, the weak rally completely failed at the apex
of the triangle.
Attachments
I have been looking at the chart since Mar 03 and notice this is the first time the up trend has been broken and I also have a target of 4280.
Does this mean the market has changed and we are now in a down trend.Bearing in mind Sell in May etc.
What does the panel think.!!
Does this mean the market has changed and we are now in a down trend.Bearing in mind Sell in May etc.
What does the panel think.!!
Fluke,
In my mind the movement down is too strong for a correction. This could be the coming of end of wave 3 with wave 5 still to come. Whether this will happen is dependant on, as ever, on the US markets...DOW breaking 10K and S&P breaking 1,088
In my mind the movement down is too strong for a correction. This could be the coming of end of wave 3 with wave 5 still to come. Whether this will happen is dependant on, as ever, on the US markets...DOW breaking 10K and S&P breaking 1,088
Fluke
after a valiant effort to regain my bottom channel line, the market failed with that rising wedge.
there must be a good chance that we have now started the
big 'B' wave down with 3900 as a preliminary target .
but we could do with a rally to about 4450 which fails, to give some sort of confirmation.
(it may not bother to rally - if it is a 'B')
on the other hand ........
FTSE100
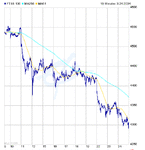
I'm getting much more interested/positive towards the FTSE100. The pattern to-day, like Fluke chart indicated, could be suggesting that the market is close to completing the move down from the 18/03/2004 (4463). The 1 day SMA held the downtrend again to-day.
However, the next breach of the 1day SMA could herald the end of this move.
Now, whether we have experienced an ABC or just part of a bigger 1,2,3 only time will tell. But it feels as if a modest buy/low risk trade is close at hand
Attachments
jonnyy
as you know, the dow theory looks at Indu and Transports.
Ftse includes too many banks, drugs etc who dont really rely on transport in a big way.
And our transport industry doesnt seem to have many quoted haulier companies (?)
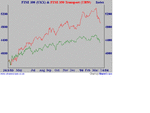
nevertheless it would be interesting to see a chart of Ftse with Transports overlaid.
perhaps we could prevail on our friends with Sharescope to post something ?
but in the meantime, here is an old chart that shows the divergence at the top of the bull market.
Attachments
Last edited:
Similar threads
- Replies
- 5
- Views
- 49K


