FTSE 100 Intraday - November

Status
Not open for further replies.
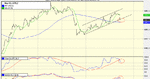
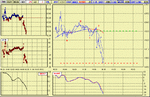
shocking isnt it....dow doig its usual gap fill and drift up..volume isnt anything to write home about either.. Looking at my charts I expect a blow off by tomorrow evening Thurs Morning..not sure the FTSE will do much between then and now...more upward bias sideways mess maybe?

See you tomorrow
 
$£"% day as you say. One small win and two losses = small loss.

Hoo, your analysis fits with my timing schedule - great if it follows through. Ftse very strange. It seems very weak, but cyclically it's high isn't due yet. Hmm.
 
same here HB
net loss today
and nicely ambiguous for the start tomorrow.
value seems to be around 4335 which gives 4297/4368
before we might know what is really happening.
still bullish though - 4450 soon
 
A bit of data in the US at lunch time ish and Cisco reports so enough things to spark off a move. I have just got a crossover on my 60 min stochs which would usually lead to a rapid move and not this trickle in the US so think its a flase starter but we are very close to topping in the US short term...(i.e might only be one of those quick 200 point reversals) but FTSE is way off the pace compared to US. Lets see what tomorrow brings
 
Wednesday 5th November

Economics
UK: October CIPS/Reuters Services PMI
UK: October Industrial Production
UK: October Official Reserves
UK: October CBI Small/Medium Enterprise Survey
US: September Factory Orders
Finals
Fenner
Interims
Trading Statement: British Airways (October Traffic)
H1: Aveva, Big Yellow, Electrocomponents, First Group, Pilkington, Shanks, Uneco, Volex, Yates
Q3: Millennium & Copthorne. Shire Pharmaceuticals
 
Bonsai.
I have noticed a snake set up today at about 4340 together with a small H&S.If 4320 goes we could be in for a fall through the fib levels from range 4280/4350.
 
suffered severe trauma yesterday. My ADSL router failed, required replacement (yet under 5 months old). Retailer wanted to return it to its own factory to test before replacing. However, after heated discussion got replacement. Then the saga of re-configuring new router. So no comment /trading yesterday.

Potential fib from move from 4212.5-4352.6
38% = 4299
50% = 4283
62%= 4266
 
Just popping in quickly.....not really to sure what to make of this. I have a cross over on my 60 min stochs similar to the US last night but they didnt push it down that much, so not convinced this is a new move just yet..
 

Attachments

  • screenshot022.gif
    screenshot022.gif
    16.9 KB · Views: 308
Bonsai, Barjon.

Notice how AVZ has become an underperformer. Having been a very good proxy for betting on a rising market, it now appears a better proxy for playing a falling market.
Any comments.
 
splitting hairs i Know but just for info using the 38% fib on my line chart above gives 96which seems to be holding so far.....the problem I have is I think chart wise(largest possible channel) it could go as low as 87ish before I would consider a major trend change has occured. So still up for me at the moment..

no major volume spike either

<img src='http://cchart.finance.ukl.yahoo.com/z?s=^ftse&a=v&t=5d&l=on&z=m&q=c&i=uk'>


edit:
Head and shoulders seems to have played out also..head was about 30 points breach of support at 24 made 94 the target
 
Last edited:
mornin' all

Mully -

AVZ been not too bad til last few days, yesterday due
to some negative news (downgrade by Warburg and getting
rid of under-performing US fund managers). Reckon it'll be back
to it's indicator status soon.

Bonsai -

My "play it by ear" method for determining whether support,
resistance, trend lines have been breached has been causing
me some grief lately. Wonder if you use any "rule of thumb"?

good trading

jon
 
Barjon:

Amvescap trading since its peak in early September @ 570p has seen two lower highs @ 562.5p (mid-sept) and 538.5p (mid- oct).

Today has seen its second lower low from 495 in Sept, 441 at beginning of October and to-day 422.5.
 
Ftse's doing a lot of 78% retraces at the moment.

Yesterdays high was a precise 78 retrace from the 23rd low to the 15th high. Todays low is a 78 retrace from yesterdays high to the low on the 31st - assuming it stops there!
 
Hi Barjon

Dont know what Bonsai would say but Ive learnt that to determin breaches you first of all have to give it time so thus use a line chart not candle chart in the same time frame as you view the support resistance in. Say you are in a 5 min chart wait for the 5 min close after the break...also look for a failed break back using the same method but you have to give it time.imo
 
just copied this over from my other computer
(must get a network card one of these days)
anyway, this is what I had a few minutes ago
 

Attachments

  • nov5.gif
    nov5.gif
    23.5 KB · Views: 269
Bonsai,
I know it is splitting hairs but your fib appears in the mid 90's. I have forgotten, do you use the close to calculate fibs? Because I used intra-day highs to produce to-days numbers of 4299, 4283, 4266.

All help/clarity greatly appreciated.
 
b£$$$">*

I have just spent several minutes trying to reply to barjon
and just as I post it, I get disconnected
so the answer is blowing in the wind !!!!
 
Hi Hooya (that's easier to write than say!!)

Thanks. I'm not having problems with failed break backs - if
I trade it, I take half position on failure and make it up to full
on move past original penetration level. It's the continued
penetration that's causing me grief - I wait for "clear water",
but what constitutes clear water?

gonna add anything Bonsai?

jon
 
Status
Not open for further replies.
Top