You are using an out of date browser. It may not display this or other websites correctly.
You should upgrade or use an alternative browser.
You should upgrade or use an alternative browser.
cpngtw
Experienced member
- Messages
- 1,525
- Likes
- 18
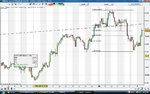
weird indeed, eur/usd H&S in an uptrend, is this normal? or am I talking nonsense?
I'm not that good with acronyms ... what's H & S
blancspa
Established member
- Messages
- 814
- Likes
- 35
I'm not that good with acronyms ... what's H & S
sorry, head and shoulders
blancspa
Established member
- Messages
- 814
- Likes
- 35
you mean daily?
daily uptrend
4Hours H&S
is confusing me
which one is stronger? 😆
RidderTrade
Experienced member
- Messages
- 1,167
- Likes
- 15
cpngtwwwwwww
cpngtwwwwwwwwwwwwwwwwwwwwwwwwwwwwwwww :clap:
Ridd what's up
cpngtwwwwwwwwwwwwwwwwwwwwwwwwwwwwwwww :clap:
captaincol
Junior member
- Messages
- 37
- Likes
- 1
Blancspa. A head a shoulders pattern can occur on either an up trend or a down trend. I'm not quite sure where you are looking at in the chart. I could see a possibility of the second shoulder forming today on the EURUSD chart, although as I'm using IG I can't get confirmation from the volume levels. This is also a small time frame for a head and shoulders, which is traditionally a much longer pattern. If you want to enter this trade based on this set up, you should wait for the right shoulder to form and break before entering.
sullystocks
Member
- Messages
- 82
- Likes
- 0
Just grabbed 25 Pips shorting GU... Does GU always tend to drop after Close? Could be a handy way to catch a few Pips at day end
captaincol
Junior member
- Messages
- 37
- Likes
- 1
Sorry I was bit slow to catch up with the messages. The 4 hour looks like a classic head and shoulder to me. It even fell the entire height of the pattern after. That's an excellent spot, I think I need to start checking the 4 hourly charts more often.
blancspa
Established member
- Messages
- 814
- Likes
- 35
Blancspa. A head a shoulders pattern can occur on either an up trend or a down trend. I'm not quite sure where you are looking at in the chart. I could see a possibility of the second shoulder forming today on the EURUSD chart, although as I'm using IG I can't get confirmation from the volume levels. This is also a small time frame for a head and shoulders, which is traditionally a much longer pattern. If you want to enter this trade based on this set up, you should wait for the right shoulder to form and break before entering.
thanks, was good to ask then... and btw volume level is the similar as yesterday, according to MT4 history centre data - 17269....if it forms HL tommorow I am going short
cpngtw
Experienced member
- Messages
- 1,525
- Likes
- 18
daily uptrend
4Hours H&S
is confusing me
which one is stronger? 😆
Here is what I see (maybe wrong :cheesy🙂
euro likely sets back a bit temporarily but will eventually make it to 1.46 - 1.47 area, may take a while since there are bunch of S/R on the way up
captaincol
Junior member
- Messages
- 37
- Likes
- 1
Pippy5000
Legendary member
- Messages
- 5,198
- Likes
- 113
I'd trade the H&S south on a break of the neckline.. below 1.38 will be sell stop and stop loss bonanza!
Hey man, I made 45 pips yesterday and just completely blew it today with bad trade after bad trade.. BUT .. this happens to me almost every week.. I just have to make more selective trades for the rest of the week rather than try to play the market video game style..
Hey man, I made 45 pips yesterday and just completely blew it today with bad trade after bad trade.. BUT .. this happens to me almost every week.. I just have to make more selective trades for the rest of the week rather than try to play the market video game style..
cpngtw
Experienced member
- Messages
- 1,525
- Likes
- 18
Just thought i'd upload the chrt for everyone. I've used the fib line just show that the break out was the same height as the height of the pattern.
I think he is talking about the bigger (potential) H & S. If it forms then the current price is at the top of the R/S (start using more acronyms 😆)
The M30 chart also confirms a short direction (on small TF, not a long TF one). So I'd short euro to it's (potential) neck of the (potential 😆) H & S and see what the price action there is, with a tight SL
Pippy5000
Legendary member
- Messages
- 5,198
- Likes
- 113
You realize that outsiders don't have a clue what we're talking about..
"I'm long on the bounce off the fib looking to t/p at the fig.. will cover on a failure"
etc.. etc.. etc..
Acronyms only serve to further confuse our friends and family..
"I'm long on the bounce off the fib looking to t/p at the fig.. will cover on a failure"
etc.. etc.. etc..
Acronyms only serve to further confuse our friends and family..