Elliott Wave Experts ?

sifts2win

Member
Messages
59
Likes
0
Hi folks,

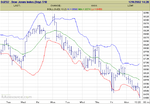
I am trying to see if there is a 1,2,3,4,5 pattern in the daily chart of the Dow from the most recent low to the most recent high.
From the sketchy knowledge I have of the subject it doesn't seem to conform which either means we haven't finished this uptrend yet or I need to study more.

Is there anyone who could elaborate on this theory and discuss whether we are still at wave 3, correcting to wave 4 or are on the way back down from the top ?

:confused:

Just interested to see the theory working in practice. I find it v. hard to see the turning points in the indices, better in the commodities.
:)
 
Sorry I didn't post a chart with last message. Is it easy to do ? I don't have access to a live feed yet and no intraday software, just using free stuff from Futuresource, Bigcharts etc. at present.

Can anyone suggest how I might post a chart ?
Thanks.
 
Hi Sifts2win

I'm no expert on Elliott Wave's but this is how I see it, and hopefully someone will correct me if I'm wrong.

Daily:
DJID5-12-02.GIF

As I see it, we've already hit the 5th wave and are now coming down from that. The 5th and final wave I believe are supposed to be the most verticle.

60min:
DJI605-12-02.GIF


Same on the 60min chart but over a shorter period

These are just my thoughts and they're worth exactly what you paid for them :D
 
Can anyone suggest how I might post a chart ?
To post a chart, get the image you want up on your screen. Press "Print Screen" and then go into any paint package, paste the image in and then save it to your hard drive.
When you post a message, theres an "Attach File" section. Browse for the file on your hard drive and Bingo. :)

It may sound complicated but it's easy once you get used to it. :D
 
Well thanks guys,

Hi Helen ! All your links are filling up my favourites section. That's another story. When will I get the time to read them ? Will catch up soon, must do some real work I suppose . Grrrrr.

FTSEB, My analysis is the same but I thought the wave 4 correction shouldn't go lower than peak 1 which is fine on the 60 min but not the daily ?

My favourite signal of all time was on Monday ! Typical as I was working in Cardiff at the time so as usual missed it. Aka Larry Williams 'Long term secrets to short term trading' The 'OOPS' signal.

Look at Dow futures on Monday. Lots of resistance around 9000, expecting a correction any day etc. and the Dow futures gap at the open above previous days range to 9040. Classic exhaustion gap which doesn't hold and falls back below previous days high. Larry Williams claims this signal has something like 80 % success rate and you sell on the break of previous high.

I have seen this signal on the Dow and SMI about 5 times this year and all have led to some serious declines or rallies from this pattern !! Next time if I actually get the chance I won't hesitate.
I believe it works on all markets in all time frames. Its worth waiting/looking for around s/r levels and in o/bought/sold conditions. Of course you could always read the book ?!

How's your trading going ?

Good luck all, keep it all going and I'll look in from time to time.
 
Thanks Traderbtf,
have copied that to read later. Are these your ideas or is this to found in some tome ? I thought fibs just retraced 38,50,62, 78 etc. and thought no more about it. Have enjoyed some success trading Nasdaq 100 off 78% level for the bounce.
Sounds very complex, could you post a chart and explain in more detail ?

Thanks.
 
Trying to attach image. Will update text if successful.

Hooray, success, well done FTSEB!

Quote:"Look at Dow futures on Monday. Lots of resistance around 9000, expecting a correction any day etc. and the Dow futures gap at the open above previous days range to 9040. Classic exhaustion gap which doesn't hold and falls back below previous days high. Larry Williams claims this signal has something like 80 % success rate and you sell on the break of previous high."


Unfortunately I can't draw on this image but I want to highlight some classic trading signals from this chart if I may. Called lots of different things (pop & drop, oops, etc.) The end of a rally or downtrend is often signalled by such 'fakes'. Novices get pulled into one more breakout or breakdown only to see the price quickly reverse. This is where hoping and hanging on will 'kill' you if you took the false signal and don't have a stop loss in place.

If you had shorted around 8950 (break of the previous days high) you could have run with this trade all the way to support around 8675. Thursday is often a 'sell' day for the Dow and the brave could have shorted again at the open or waited for the 'bear flag ' to break down around 8700. This predicted a target around 8450 once support broke and became resistance around 8675. It duly obliged last night !

It will be interesting to see if resistance holds at 8675 or as I suspect a short term break will occur for a run back up to 8800 b4 the final descent begins again. (who knows ?!)

(9000 was obvious resistance and maybe a completed Elliott wave in the dailies and 60 min chart had also occured - 3 signals to sell did make this opportunity one worth catching and the 'oops' entry would have got you in close to the top).

The entry at 8950 and exit at 8450 (All predetrmined levels) would have resulted in a perfect trade for 500 points. Easy with hindsight and yes I wasn't there to take it. However I have seen it lots of times and it works! the bear flag is more obvious in a 15 min chart. The target predictions from these flags also work time and again.

Hope it makes interesting reading. GL in your trading!
 

Attachments

  • cayfktmz.png
    cayfktmz.png
    15.1 KB · Views: 508
Last edited:
I will give you the information I have, from 1932to 2000 there
has been a Supercycle 5 wave formation, with the impulse waves 1,3,5. The 5th wave topped in 2000, now its started in a
3 way downward correction and applying fibonaci it will end
somewhere around 350- 500 for the S&P.
I can elaborate on this if you want. Regards ejo
 
Top