Elliott Wave EUR/USD

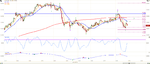
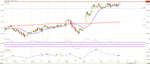
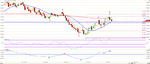
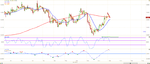
Here is an updated hourly chart...My take profit is 1.0750

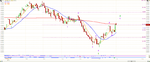
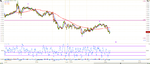
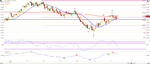
Well this call on the hourly was bad, but I did go long today...The hourly is the hardest chart for me to trade................. But I am still looking for a new high on the daily
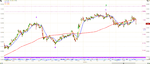
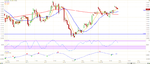
............If anyone can help me on the hourlies then that would be great............. I still think that the Aussie is still going up,,,,, but not for new highs on the dailies................
 
I use the ISR and The TRIX underneath my chart and the 8,21 and 200 MA on the chart. Here is an hourly chart. The daily outlook hasn't changed since my last post so I am not posting a new daily chart right now. I can say that we are starting into wave 3 of 3 on a minor scale so this move down should be nice.
 

Attachments

  • AUD_USD_1Hour_6_28_12.png
    AUD_USD_1Hour_6_28_12.png
    56.5 KB · Views: 165
I use the ISR and The TRIX underneath my chart and the 8,21 and 200 MA on the chart. Here is an hourly chart. The daily outlook hasn't changed since my last post so I am not posting a new daily chart right now. I can say that we are starting into wave 3 of 3 on a minor scale so this move down should be nice.

OK, here we go...I am posting up a 5 minute chart here because i think it is important........Germany just said that they would give aid without austerity, but where will the money come from??? The Aussie went up over 100 pips after the announcement, but it is in a wave 4 triangle right now on the 5 minute chart which was my alternate count on the hourly chart that said "2 or 2"...... I suspected it would make new highs for wave 2 on the hourly, but not new highs on the daily... The triangle on the 5 minute means that it will have 1 more push up before a reversal............ This reversal should still be wave 3 of 3 on a minor scale and should make new lows on the daily charts.....
 

Attachments

  • AUD_USD_5_min_6_28_12.png
    AUD_USD_5_min_6_28_12.png
    52.1 KB · Views: 167
Here is my last post for tonight... I am posting up another 5 minute post and it has gone just as I thought it would.............. There are new highs above the triangle on the 5 minute chart, and now this move up should be over soon...I am selling here
 

Attachments

  • AUD_USD_5_min_6_28_12.png
    AUD_USD_5_min_6_28_12.png
    42.3 KB · Views: 163
This is very intriguing, The same Elliott Wave patterns that were happening 70 years ago are still happening today.................... Even with technology and super fast micro trading from the big firms...
 
This is very intriguing, The same Elliott Wave patterns that were happening 70 years ago are still happening today.................... Even with technology and super fast micro trading from the big firms...


Maybe now would be a better time to short?
By the way this is not a dig at you.
 
Maybe now would be a better time to short?
By the way this is not a dig at you.

You are right HW. I am posting up a daily chart and it is much clearer. Now is not the time to short. The daily has not made a fifth wave yet as it should for a C wave. Just look at the chart. BTW, I am going to start a new thread called the Aussie and U.S Dollar because when I started this one I was looking at the Euro mostly, but as time has gone by I realized that I like the Aussie U.S Dollar pair the most out of all the Forex pairs.............
 

Attachments

  • AUD_USD_Daily_7_1_12.png
    AUD_USD_Daily_7_1_12.png
    54.4 KB · Views: 168
here is the hourly chart...............
 

Attachments

  • AUD_USD_Hourly_7_2_12.png
    AUD_USD_Hourly_7_2_12.png
    44.3 KB · Views: 155
here is the hourly chart...............

One thing I have noticed about the hourly Forex charts is that the "X" axis of the chart gets a little stretched out do to the inclusion of the off hours. For the type of analysis that I do it is much easier to use the four hour charts for forecasting and then switch to hourly in active times of the trading day. I know you asked for help with them (hourlies) and that's about as much as I can give off handedly any way.:)
 
Oh, and please put a link in this thread for your new one!

P.S. Just to make sure I don't miss it.
 
Oh, and please put a link in this thread for your new one!

P.S. Just to make sure I don't miss it.

Thanks for the good work HW. I just have noticed the 5 minute chart has made five waves down and is currently in a corrective wave back up. This is interesting because I thought the Aussie was going up 50 or 60 more pips before reversing... Anyway, here is the chart.......
 

Attachments

  • AUD_USD_5_Min_7_3_12.png
    AUD_USD_5_Min_7_3_12.png
    40.7 KB · Views: 156
Thanks for the good work HW. I just have noticed the 5 minute chart has made five waves down and is currently in a corrective wave back up. This is interesting because I thought the Aussie was going up 50 or 60 more pips before reversing... Anyway, here is the chart.......

So what clicked about the Aussie for you? The time of day that it moves? Are the wave forms easier for you to see and work with? You like that movie "The man from Snowy River"?:cheesy:
 
So what clicked about the Aussie for you? The time of day that it moves? Are the wave forms easier for you to see and work with? You like that movie "The man from Snowy River"?:cheesy:

The waves of the Aussie are easier for me to see than on any other pair and it moves quite a bit and the spread is good............Those 3 things are all good for me..........

Anyway here is my 1 hour and daily charts............. There does seem to be some room to the downside to about to about the 1.0215 on the hourly charts and the last move up on the daily should top out for a 61.8% retracement at the 1.0375 area and finish the C wave there........... Of course it could go as high as 1.0854 without breaking any Elliott Wave rules, but I don't think it will...

P.S., I never saw the man from snowy river.............
 

Attachments

  • AUD_USD_Daily_7_4_12.png
    AUD_USD_Daily_7_4_12.png
    49.5 KB · Views: 134
  • AUD_USD_Hourly_7_4_12.png
    AUD_USD_Hourly_7_4_12.png
    45.7 KB · Views: 156
One thing I have noticed about the hourly Forex charts is that the "X" axis of the chart gets a little stretched out do to the inclusion of the off hours. For the type of analysis that I do it is much easier to use the four hour charts for forecasting and then switch to hourly in active times of the trading day. I know you asked for help with them (hourlies) and that's about as much as I can give off handedly any way.:)

That is good advice that I did not know before HW, so thanks to you I have more ammo in my trading arsenal...
 
Thanks for the good work HW. I just have noticed the 5 minute chart has made five waves down and is currently in a corrective wave back up. This is interesting because I thought the Aussie was going up 50 or 60 more pips before reversing... Anyway, here is the chart.......

I scaled back on the five minute and it looks like it very well like it may make 5 waves down on a larger scale. I am also posting a daily chart showing that wave 2 could be possibly be over, but if it's not then it should go down to around the .9900 area before making new highs...........But if in fact wave 2 is finished then all of the surprises will be to the down side...
 

Attachments

  • AUD_USD_Daily_7_9_12.png
    AUD_USD_Daily_7_9_12.png
    49.8 KB · Views: 153
  • AUD_USD_5_Min_7_9_12.png
    AUD_USD_5_Min_7_9_12.png
    57 KB · Views: 139
Dollar strength for the next day or 2.

As usual I was a bit early but I am posting a 1 hour chart . It appears that on this pair has indeed started a wave 3 down on a minor scale. The thrust is there and that is why I am posting this chart tonight. Wave 3 is usually the longest and strongest wave so I accept that and think this one will be that way.......
 

Attachments

  • AUD_USD_Hourly_7_11_12.png
    AUD_USD_Hourly_7_11_12.png
    59.6 KB · Views: 146
Here is the Aussie daily chart. I will be looking for a daily close over the 8 moving average to confirm wave 2 is going higher. If it closes below the 1.0097 then that will be pretty good confirmation that wave 2 is over and it is in a third wave down. I already sold it several hours ago and hope I can hold the short for at least several days.
 

Attachments

  • AUD_USD_Daily_7_15_12.png
    AUD_USD_Daily_7_15_12.png
    54.3 KB · Views: 161
Here is the Aussie hourly chart as well. There is divergence on the RSI and a sell signal on the trix and fractal.
 

Attachments

  • AUD_USD_Hourly_7_15_12.png
    AUD_USD_Hourly_7_15_12.png
    49.4 KB · Views: 146
Here is the Aussie daily and hourly chart. On the daily chart I don't like the fact that the correction fell short of the Fibo 61.8 retracement, but that could mean a very strong down move as well. On the hourly chart, There is a very nominal high here and this pair just can't seem to get any traction to the upside...... I am still favoring a strong down move, but I am trading it cautiously at this point. If it picks up momentum to the downside then I will be piling on with the crowd....
 

Attachments

  • AUD_USD_Daily_7_16_12.png
    AUD_USD_Daily_7_16_12.png
    51.4 KB · Views: 182
  • AUD_USD_Hourly_7_16_12.png
    AUD_USD_Hourly_7_16_12.png
    51.5 KB · Views: 139
Top