Trader Skillset
Active member
- Messages
- 182
- Likes
- 6
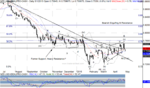
USDCHF Wave Count
We did indeed see a three wave rally from the wave 1 or A low, and last week’s action makes it seem like our top count is on track. We’ll look for a short term corrective bounce, followed by further declines regardless of whether or not the larger count is bullish or bearish. We are showing the point where wave 3/C would be equal to wave 1/A, and the 161.8% line. The equality measurement is really the dividing line between the two counts, since weakness below there increases the probability of the 1, 2, 3 versus the A, B, C.

Similar to other pairs, a small dollar rally would likely be an opportunity here too – for the bears. The decline from the wave 2 or B high isn’t a complete impulse yet, though, but we do think the path of least resistance is lower.

We did indeed see a three wave rally from the wave 1 or A low, and last week’s action makes it seem like our top count is on track. We’ll look for a short term corrective bounce, followed by further declines regardless of whether or not the larger count is bullish or bearish. We are showing the point where wave 3/C would be equal to wave 1/A, and the 161.8% line. The equality measurement is really the dividing line between the two counts, since weakness below there increases the probability of the 1, 2, 3 versus the A, B, C.
Similar to other pairs, a small dollar rally would likely be an opportunity here too – for the bears. The decline from the wave 2 or B high isn’t a complete impulse yet, though, but we do think the path of least resistance is lower.