Elliott Wave Analysis

GBPUSD Wave Count

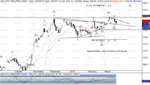
It’s difficult to get too excited about the pound here, but there’s a couple of signs of life. First, we can count a five wave decline from the wave 4 high, and last summer’s top. Second, prices rallied in five waves from the FOMC low. Lastly, a small bearish divergence showed up into this week’s low. On the negative side, however, prices have substantial overhead resistance, where GBPUSD recently failed at 1.5555. It’ll take a move above there to indicate our count is actually correct. That’s especially true since weekly and monthly RSI suggest the “sustainable bear” is ongoing.

GBP-Daily-Elliott-3-21.PNG
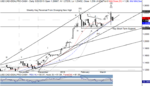
Further short term gains here wouldn’t be surprising. Prices rallied in five waves and declined in three from the low. The bounce from Thursday’s low also appears to be impulsive. The short term trend channel should provide both support and potentially resistance. What will divide the bullish interpretation, from a bearish alternate would be the point where wave iii/c would be equal to the wave i/a rally. Above and beyond there, and a larger rally phase is likely underway, potentially lasting a month or two, after the pound being down 8 of the last 9 months.

GBP-240-Elliott-3-21.PNG
 
AUDUSD Wave Count

Prices have yet to break the longer term channel on a closing basis, however, no new low on the week, and “stickiness” to the upside suggest a change in behavior. Prior fourth wave resistance isn’t out of the question even in a longer term downtrend, and that reaches as high as .8295. Should we see a daily close above the trend channel, the broken line will become support. In addition, the base channel should be instructive with respect to AUDUSD’s intentions.
AUD-daily-Elliott-3-21.PNG

We’re near term bullish against the .7695 area, looking for at least a push beyond Wednesday’s high. Such a move, though, will also push AUDUSD beyond the down channel, allowing for a further rally phase, we think in wave B. Look for the broken down trendline to provide support early in the week, and ideally prices should remain above the shorter term up trendline as well. A break of that will have us on-guard.

AUD-240-Elliott-3-21.PNG
 
NZDUSD Wave Count

The Kiwi’s strong week, and rally from support, likely means wave B is still ongoing. Prices tested former support/resistance on Friday, yet seem poised to push through next week. We’ll look for a push back into the prior fourth wave extreme, similar to Aussie, as long as the short term up channel contains prices. In prior issues, we’ve highlighted support and resistance in the .7700 area, and above that level would likely change a lot of trader’s minds. Of course, once prices reach .78-.8000, that’s the point where prices are likely to find another top and turn back down.
NZD-daily-Elliott-3-21.PNG
Shorter term, we can see that RSI has reached into “sustainable bull” territory. Of course, longer term charts don’t confirm that. As such, we’re looking for higher prices per the top count, albeit in a larger time frame down trend. In other words, it’s counter trend. Regardless, we don’t want to fight higher prices over the coming weeks, as long as we remain safely above the wave .ii of iii low, and ideally the short term up trendlines.

NZD-240-Elliott-3-21.PNG
 
USDCHF Daily Wave Count

We have a couple of challenges with respect to USDJPY, the first of which we’ve mentioned before. Wave E of the wave (4) triangle either truncated per the alternate count, or in our top count, ended in what looks like one wave. So, here’s the options:


1. We have a leading diagonal underway for wave 1 of (5).
2. We have an ending diagonal underway for all of wave (5) (i.e. 1, 2, 3, 4 , 5 = ending diagonal).
3. A diagonal for waves (i) and (ii) (or 1 and 2) have just unfolded.

All three counts will yield higher prices straight away. Supporting these bullish counts are the fact that the action down from the high looks corrective, that prices bounced at the broken down trendline drawn off of the wave (3) high, and that the BOJ and Japanese government want to print the yen into oblivion.

There are a couple of near term bearish counts, though:

1. A new high was achieved, so wave (5) may be complete.
2. Wave (4) may be ongoing with the recent high being a B/X wave, and prices will trade lower to complete wave (4).

Both of these counts are supported by the bearish divergence on RSI into the top, and the fact that the yen has outperformed most currencies since its December high. Is this subtle out performance speaking to the fact that the larger rally up from the all-time low for USDJPY is complete? A break of Wednesday’s low, and especially 118.24, will warn that something is amiss with the bullish outlook.
 

Attachments

  • JPY-daily-Elliott-3-21.PNG
    JPY-daily-Elliott-3-21.PNG
    70.3 KB · Views: 244
USDCAD Wave Count

It’s not always easy to listen to the message of the market. But, in the case of USDCAD, the rejection from new highs on a weekly key reversal, after thrusting from a triangle, followed by a break of short term up trendline says that prices are inclined to trade lower.

CAD-daily-Elliott-3-21.PNG

Shorter term, we can see key support near the apex of the former wave (iv) triangle, where prices bounced from on Wednesday. A break of that level will leave the bears in control in what should be a rather large, and potentially sharp, wave (4) correction. Revisit our chart comparing the current rally to that of 2008, and especially notice that traded down 13 handles over several months before pushing to a new high in ’09.

CAD-240-Elliott-3-21.PNG
 
USDCHF Daily Wave Count

Many Elliott based traders, including myself, are ignoring USDCHF. Maybe we should pay more attention, given this week’s action, though. Certainly, we can see that prices failed to reach a new high this week, and also failed below that pre-peg removal high. Such action leaves a couple of lower highs in place, and while there is some structural support below we wouldn’t be shocked to see the franc find buyers. In a world where everyone wants a weaker currency, the Swiss National Bank’s reluctant allowance of a higher franc is a tacit recognition that a weaker currency isn’t universally beneficial. Imagine that – subsidizing exporters at the expense of every other citizen isn’t a panacea.

CHF-daily-Elliott-3-21.PNG
 

Attachments

  • CAD-daily-Elliott-3-21.PNG
    CAD-daily-Elliott-3-21.PNG
    70.2 KB · Views: 223
There is decent price action on USDCHF however, with recent events I am still very much on the sidelines.
 
USDCHF Daily Wave Count

The Swiss franc is going to have to show a very clear pattern for me to get involved. The five down from the wave (5) high isn’t textbook, but a corrective bounce would allow us to turn bearish. Support still exists in the .93-9500 area, but if we saw an opportunity near .9800 we might actually be willing to look lower aggressively. Allow for early week strength, and then a downside reversal near the 50% retracement level, would have us scouting for entries.

]CHF-Daily-Elliott-3-28.PNG
 
USDCAD Wave Count

After last week’s key reversal, it was easy to hold a bearish view. But, this week’s action on Thursday and Friday suggest a pause in that view. Prices reversed from a test of our “Key Short Term Support” mentioned last week, and often, a false break is important. In this case, a intraday break of the uptrendline was reversed, resulting in a “hammer” candlestick on Thursday, with follow through action on Friday. We can’t argue with a bullish stance versus Thursday’s low, and that remains key support. A larger range, or (b) wave rally may indeed be the game.
CAD-daily-Elliott-3-28.PNG

So, USDJPY is bearish, but USDCAD is bullish? That might present an opportunity in CADJPY if both counts are correct. Shorter term on USDCAD we can see the action down is in three waves and bounced sharply from support. A break of 1.2474 will likely mean that a larger corrective decline is underway per the top count. But, notice the break of the down trendline, and then kiss of the intersection of both lines on Friday. That’s the type of action we were referring to on AUD and NZD.

CAD-240-Elliott2-3-28.PNG
 
USDJPY Wave Count

So, the action down from the high is not an impulse wave, we know that. We also know the action up from the wave (4) low was not an impulse; it was either an ending diagonal for wave (5) per the top count, or it was a leading diagonal per the alternate. The dividing line between these two counts is the short term down trendline drawn off the high. Keep in mind, that if the alternate count is the operative one, the rally will extend potentially towards 126.00. And, if the bearish view is correct, we’re still likely to see an early week bounce.

JPY-Daily-Elliott-3-28.PNG

So, allowing for an early week rally makes sense, but it seems likely to fail. While we are longer term bearish on the yen, (agreeing with one fund manager friend’s target for USDJPY of infinity) the yen may show some strength first, and a break of this week’s low, and the wave (4) low, would mean a decline of some substance was underway. We’re not thrilled about the prospects of being long something being openly destroyed by the BOJ and Abenomics, so this bearish count serves as more of a warning than a desire to stockpile yen. Kyle Bass (et al.) will eventually be correct, although no market moves in a straight line. Wait to refinance your mortgage into yen until the wave II decline is complete.

JPY-240-Elliott-3-28.PNG
 
NZDUSD Wave Count

Monday’s close confirmed the short term trendline break, and it was another attempt at pushing beyond the prior wave (iv) low. Tuesday’s reversal bar, a bearish engulfing pattern from resistance put a damper on the bullish action, but there wasn’t much of a spirited decline. In my view, the action down from this week’s high looks corrective, and a larger B wave remains the call. A break back below the down trendline of off the wave (iv) end would mean bears were still in control and to prepare for new lows.

NZD-daily-Elliott-3-28.PNG

We have some clear levels to watch next week. Certainly a push above the short term down trendline will turn us bullish against Friday’s low, so similar to AUDUSD, we’ll be watching this pair closely early in the week. A drop below Friday’s low, while not completely bearish, would set up a test of the up trendline. RSI’s push into sustainable bullish territory allows us to be bullish on shorter term timeframes, although nimble is probably still the best strategy. Given that former resistance becomes support, a push above this week’s high will allow for a push towards wave (iv)’s extreme, if not higher.

NZD-240-Elliott-3-28.PNG
 
AUDUSD Wave Count

The push above the longer term down trendline this week was a bullish development, but bulls faded as the week closed out. RSI has yet to confirm a larger bullish wave is underway, but we did have some bearish divergence into the wave (v) low. Often, after a longer term trendline break, markets will retest the broken line, and that may be what AUDUSD has in store for us this week. A drop below the line means we’re still searching for the wave A low, but any daily upside reversals could lead to substantially higher prices (towards .8300).

AUD-daily-Elliott-3-28.PNG

There is a series of three higher highs and three higher lows since the wave A low. That suggests sticking with our bullish view, but prices need to turn higher shortly. A turn above the short term down trendline could unleash a torrent of buyers scrambling to cover shorts. There’s no reason for prices to be below the .7700 area if a bullish resolution is going to happen, although critical support for the bullish view is the wave .ii of iii low. We’re going to watch this pair intently the early part of the week, as we’d love to turn aggressively bullish on an impulsive push above the down trendline.

AUD-240-Elliott-3-28.PNG
 
GBPUSD Wave Count

Long term support at 1.4813 initially gave way but is still supportive of prices. Structural resistance from the wave 3 low, and from the wave i/a high down trendline also suggest the upside remains challenged. But, similar to the euro the decline is stretched, and a larger corrective bounce wouldn’t surprise us in the least. Nonetheless, like most market participants, we’re a bit reluctant to bet on our analytically count with actual capital, other than on a very nimble basis.

GBP-Daily-Elliott-3-28.PNG

We do have a number of interesting technical points on the shorter term chart, though. First, the RSI on a 4-hour bar chart diverged into the low and has experienced a series of higher lows. While prices remain beneath the down trendline, and have broken the steep up trendline, the action ever since 3/20 looks corrective to the downside. After a very sharp rally in wave i or a, corrective action down either means a larger push to the upside is coming in iii/c, or a triangle. We’ll look to follow a trendline break in either direction on a short term trading basis.

GBP-240-Elliott-3-28.PNG
 
EURUSD Wave Count

The action up from the low isn’t an impulse wave. But, many large corrections have begun from a small three wave move that corrected an extreme, so don’t pre-judge the extent of the move given the oversold extremes. Instead, let’s focus on the evidence. One daily close above the down trendline, RSI barely touching above 50 and prior support (now resistance) from the wave 3 low all suggest lower prices. However, a push above Thursday’s high would mean that either the double zigzag wave (iv) count, or something more bullish was underway.

EUR-daily-Elliott-3-28.PNG

The larger count is still in question, although the wave (iv) label is getting awfully large relative to its corresponding wave (ii). A push above the short term down trendline would have us allowing for something more bullish per one of the alternates, both of which would remain above Friday’s low, and ideally the up trendline. Notice that the shorter term RSI is suggesting something more bullish could play out. There’s nothing wrong with ignoring a market on a swing basis that doesn’t provide any ideal situations. We’re focusing elsewhere.

EUR-240-Elliott-3-28.PNG
 
GBPUSD Wave Count

You can see the long decline here in GBPUSD from last summer’s high. What’s important to point out this week is the bullish divergences present into last week’s low, along with the push above two short term trendlines. First the down trendline off the wave 4 high was breached, along with a push through the barely visible dotted midline of the trend channel. Both moves suggest our larger “bottoming” call is correct. A return to the prior fourth wave extreme at 1.5500 would be “normal” behavior.

GBP-Daily-Elliott2-4-19.PNG

Within Elliott five wave moves are impulsive, and three wave moves are corrective. But, if one of the sub-waves of an impulse is extended, an impulse can appear to be nine waves like the rally in GBPUSD above. And, keep in mind that a double zigzag will be seven waves (ABC-X-ABC), and triple zigzag will be 11 (ABC-X-ABC-X-ABC). So, five and nine are impulses, while three, seven and 11 are corrective. That being said, the impulse here is clear. A corrective decline is due to start the early part of the week, and we’ll be looking for corrective downside action to hold the 1.4800 area which is near long term support and the wave iv of (iii) low.
GBP-240-Elliott-4-19.PNG
 
EURUSD Wave Count

Last week we pointed out that we thought a new low would be quickly reversed given the extended nature of the decline. The Elliott count has many possibilities that are about equally viable in our assessment. That’s what led to our intro – when Elliott isn’t providing a clear near term Context, we focus on momentum and signals, along with other technical indicators. Here’s the longer term possibilities:

1. Wave ((C)) has bottomed, very near the 1.0304 long term equality measurement with wave ((A)). Supporting this idea is the very mature decline and the Elliott trend channel acting as support. Either a complex upward correction or leading diagonal is underway.
2. Wave (iv) of 5 is unfolding as a triangle of flat. This allows for trade up to the mid 1.10 area before a new low is seen.
3. Wave (v) of 5 truncation at 4/13 low.
4. Given the RSI profile in “sustainable bear” territory into the low, the decline is still subdividing lower in a manner not accounted for as of yet.

The break of the down trendline and retest of the trend channel stand out as important near term developments in my mind. In addition, the lack of anything impulsive to the downside since the 3/18 high suggest further upside corrective action.
EUR-Daily-Elliott-4-19.PNG
Unlike GBPUSD, the rally up from last week’s low is NOT an impulse, because there is significant overlap present. RSI has vacillated between sustainable bull to bear territory too. This is why we led with GBPUSD, and why we’ll be ignoring any swing trades in EURUSD this week. We are getting nothing clear from Context or Momentum on a daily or 240-minute basis.
EUR-240-Elliott-4-19.PNG
 
AUDUSD Wave Count

Similar to the euro, Aussie was able to remain above the lows last week. That makes at least four significant attempts to break the .7600 area, yet prices have been able to remain below that level more than a few hours. Such action suggests a base for a push higher, and the move above both down trendlines suggest the decline from at least the July ’14 high is complete. Notice that the last two attempts lower have seen RSI remain above the “sustainable bear” territory in grey. Last week’s push above 50 suggests the near term trend is higher too. There’s still heavy resistance around the .8000 area, though, and the initial action up from the low appears to be corrective. Regardless, last week’s action was bullish, and notice that Friday’s close was above the trendline. Any early week pullback may provide the bulls an opportunity.

AUD-Daily-Elliott-4-19.PNG
We want to highlight the fact that the initial rally off the low (wave a) is not an impulse. With b failing to reach a new low, it seems a fairly textbook flat correction has unfolded. The decline we expect in the early part of the week will tell the larger story. Since a downward correction will move AUDUSD back below the trendlines, bulls need to be cautious.

AUD-240-Elliott-4-19.PNG
 
NZDUSD Daily Wave Count

Confidence in the top count was low last weekend, but prices traced out a hammer on Sunday with a bullish follow through candle on Monday. We mentioned that Kiwi was the “pair to play” for dollar weakness, and we saw nice bullish action late in the week. The top count remains in place, and notice that prices are above the near term down trendline, and that RSI has a nice trend up. A decline early in the week to retest the broken trendline is an opportunity for the bulls. Critical support for our bullish view is .7422, but realistically, prices have no reason to be below the up trendline.

NZD-Daily-Elliott-4-19.PNG
 
USDJPY Daily Wave Count

Shorter term action isn’t all that clear, but two things are clear. First, there’s a three wave rally for wave (b) that is unmistakable. Second, the action ever since the wave (3) high is non-impulsive in both directions. The break of the up trendline drawn off of the wave C of (4) low has been broken, although prices do remain above the key support at 118.30. There’s few people who are as bearish the yen as The Wolf longer term, but my gut says the yen rallies (USDJPY declines) prior to its next debacle. If USDJPY is indeed going to decline, there’s no reason for prices to be above the down trendline, although there seems to be easier fish to fry.

JPY-Daily-Elliott-4-19.PNG
 
USDCAD Daily Wave Count

Wednesday’s break of 1.2400 saw prices collapse. In fact, daily RSI reached the “sustainable bear” zone, after diverging into the wave (3) high. So, both daily Context and Momentum suggest lower prices, and now 1.2400 is resistance. A rally back into the underside of resistance that looks corrective will be a bearish opportunity.
CAD-Daily-Elliott-4-19.PNG
 
Top