Trader Skillset
Active member
- Messages
- 182
- Likes
- 6
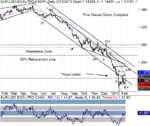
We wanted to start with the daily chart for EURUSD because it shows a clear impulse wave to the downside from this summer’s high. It also shows a “throw under” in wave (v) to the downside into a “panic type” low. Prices have now returned to the underside of that broken channel line, and a push above 1.1534 would reverse over leveraged bears, spark a return as high as the “Resistance Zone” and set up the next phase of the decline.


Drilling down to the 240-minute chart, we see a couple of notable technical items: Prices held 1.1262 support this week. RSI turned up from the “bull trend support” (lower blue zone). Five waves down from the wave (iv) high are complete. The action down from the wave a/i high appears to be corrective. Even if we took the view that EURUSD is going to head down directly to par, to fulfill our longer range objective, a corrective bounce could still see the 1.1680 area first (prior fourth wave extreme). We are nimble bulls here looking for at least that level, but potentially more.


Drilling down to the 240-minute chart, we see a couple of notable technical items: Prices held 1.1262 support this week. RSI turned up from the “bull trend support” (lower blue zone). Five waves down from the wave (iv) high are complete. The action down from the wave a/i high appears to be corrective. Even if we took the view that EURUSD is going to head down directly to par, to fulfill our longer range objective, a corrective bounce could still see the 1.1680 area first (prior fourth wave extreme). We are nimble bulls here looking for at least that level, but potentially more.


