Dow Intraday Charts 9 Feb - 13 Feb

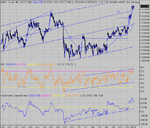
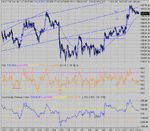
Possibly back into the old 10 min up channel that we so graciously dropped out of last time AG made his opinions public. if so support currently at c650 and rising into the close.

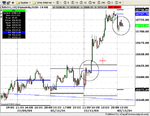
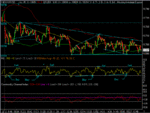
TS - those new colour charts show a femine side none of us knew existed. :cheesy:
 
hang on - 5 min showing triangle break out with divergence, 10 min showing bull flag forming and I min bouncing arnd '64 and 100 MA

urgh !

TS - Prefer the black background charts too, but in the interests of the summary .....
 
OES – I think that you’re right about the ‘old’ 10min channel lower line likely offering support, and think it should be known as the ‘Shark Channel’ as you spotted it first……..! :cheesy:

My charts are going to be all pretty pastel colours from now on, dear……… ;)

SteveChump – can you post a chart to show how you are counting the waves……?
 
Have not mastered the art of uploading charts,but if you put up a 5 min chart the 1st and 3 rd waves shout at you as does the ever so boring 4th corection which is forming in a ledge. The support line is actually a previous high @ 10658

1st wave off the low to day was about 40pts ..if the 5th wave is about the same that would put us in the 690's testing the recent high at 10700. Presume if that fails then we have a failed double top and a nice correction coming up. Hard to see it closing above 10700 to form a new significant high. Probailities would suggest otherwise I think.


Now well back into the middle of the ledge and I prseume it will try the upside break

Cheers
 
Last edited:
Frugi's Fib road (just for fun)!

Of course if the Shark channel support fails this count is off...

Interestingly the same projection applied to ES gives a target of 1162 which is very close to the 50% retracement from the all time high to the Oct 2002 lows.
 

Attachments

  • indu.jpg
    indu.jpg
    115.2 KB · Views: 575
Last edited:
A fantstic commentary from many traders.

I have not read the comments for a long time and usually just scroll down looking for CM's charts, mainly due to time constraints.

I was so entertained and enlightened by the comments of all the traders new and old alike!

Tradesmart

You do provide excellent commentary, contrary to what you may think.

Wellshot
Provides a fantastic view of elliot wave theory applied to the dow and related instruments. This has previously been a dark area for me as I have not read anything related to the subject before and am sure you will open the eyes of many traders to this unappreciated field of endeavour.

It's is brilliant to see so many traders help each other- No question is too simple.

Newtron Bomb

Thanks Newtron. Your efforts are top dollar too. Comments like this provide invaulable encouragement to those that think that maybe it's not worth the effort....
myself included.
 
Interesting day. See the big triangle on the left- that had T1. The reverse triangle/expanding wedge on the right had T2. Easy after the event, but I didn't spot the possibility yesterday.Did anyone spot it? If you did, it must have been invaluable today!
I'll guess the middle trend line, showing a close and pullback just above it. Not a lot of room for upside on RSI, so I think we'll se a pullback tomorrow.IF the market doesn't want down, maybe it'll only drop to 700 with a substantial drop in RSI givine goom to move to channel top.790 ish?
 

Attachments

  • dow 11-02-04 10.gif
    dow 11-02-04 10.gif
    40.9 KB · Views: 554
Short report, two targets from triangles, T1 and T2. T1 was tricky as there followed a 24 point pullback that was really swift.. T2 was nice and easy, both targets being reached before the triangle apex. Closing at close to HOD adds strength to the possibility of moving up before a pullback.
 

Attachments

  • dow 11-02-04 1.gif
    dow 11-02-04 1.gif
    23 KB · Views: 522
CM

Embarrassing as it is, I can not make out the triangles & targets on the 10 min chart. When you get a moment could you make it a Little clearer on th chart.

Thank you


Kathy
 
Recuring patterns

Hiya folks

Just a quick observation that seems to work accross the markets

I'm predominately a patterns person. In the chart you can see the similarities to that of yesterdays opening consolidation.
The consolidation is also near the HOD as yesterday and near the close of the previous day as with yesterdays pattern.
We also know that the markets were waiting for announcements from Greenspan which was at about this time.

So, can we expect another explosive move today with a similar set up... keep watch and lets see what triggers the move today.

(Edit) I should have also pointed out that it was a mirror of yesterdays pattern imo

On forex i have observed this pattern recurrence numerous times, for example gbp/usd can see a 3 peak rising top two days on the trot, this usually leads to an explosive continuation while looking at the the math indicators it shows a clear divergence.

May the spread be with you

Newtron Bomb
 

Attachments

  • 12-02-04 indu 10min.png
    12-02-04 indu 10min.png
    78.3 KB · Views: 414
Last edited:
OK, so NB's plan didn't pan out Today. But don't dismiss it as a bad call.That's not how it works. Our decisions should be based on what we have learnt from the past.
My plan did pan out, dropping back to broadly where I suggested, around 700, giving a lot of room for a move up.So NB's plan should come good tomorrow....
Shall I hazard a guess at 869 target? Perhaps not- it's too far away from my comp. entry. :cheesy:
 

Attachments

  • dow 12-02-04 10.gif
    dow 12-02-04 10.gif
    38.9 KB · Views: 374
What can I say about today? Nothing.What a boring total waste of time and effort. : :eek:
Plenty of volume, but absolutely no movement. Is that support at 690 ? :cheesy:
Maximum deviation from the 100EMA was 20 points. Could have stayed in one trade all day and made zilch.
 

Attachments

  • dow 12-02-04 1.gif
    dow 12-02-04 1.gif
    28.3 KB · Views: 365
CM
Thanks for the drawing I was looking for a separate triangle on the right not using the base of the first one on the left.

Thanks

Kathy
 
Despite the general choppiness of the index yesterday, as it formed yet another lengthy triangle, there were a few points on the table for the trader with a keen eye for RSI PD/ND and the confidence (blind faith?! ;) ) to follow it.

Alternating long/short or just working one way would have added some points to your account – the only rule is to watch the RSI divergences – they are always meaningful in this kind of ‘sideways’ market- ignore them and get whipsawed……the only non-divergent top traded was at * where the lower high and prompt reversal gave the clue (apart from the fact that it was clearly at the top of the RSI range)

I noticed that even CM was scalping the other evening so that kind of legitimises it!?! :cheesy:

At the end of yesterday, I was thinking that this was likely to be a flat bottomed bear triangle, but I notice the futures are around 10725 now, so will be watching the open closely – Consumer Sentiment data at 14.45 could set the tone…..
 

Attachments

  • 13-02-04.gif
    13-02-04.gif
    24.2 KB · Views: 332
tradesmart said:


At the end of yesterday, I was thinking that this was likely to be a flat bottomed bear triangle, but I notice the futures are around 10725 now, so will be watching the open closely – Consumer Sentiment data at 14.45 could set the tone…..

hmmm maybe we will get the open higher and then a pull back to 10650/60 to see if it bounces off the hourly trendline for medium term continuation upwards i,m not going to fade the open short if it opens circa 720/5 rather wait to see if it hits 650/60 before looking at long trade. surely that 10650/60 trend line needs to be tested ? we'll see.

jd
 
Kathy, don't even think about scalping, unless it's for a bit of fun at the end of a profitable day, and you keep the stakes really low!!! You could lose 50 + points in a twinkling of an eye. Best on offer yesterday was 25 points, less the spread.
 
CM

Have been there & done that.

I was just looking at TS charts it looks so easy when looking back over the day, not so in realtime when you do not know what is coming next.

Do you always trade the 1 min charts or do you look at the 3 & 5 min?

Looking at the 3 min it does seem to get rid off a lot of the whipsaws, but you miss out on points.


Kathy
 
Top