You are using an out of date browser. It may not display this or other websites correctly.
You should upgrade or use an alternative browser.
You should upgrade or use an alternative browser.
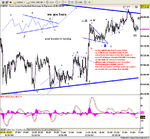
Took a while for something to happen, and when it did, it was a bit of a damp squib..from the breakout at 585, the target was a bit vague as the triangle was really messy- but around 605-508.But the RSI dip to 20 forming a potential RS Switch was the key to the next move, although RSI dropped too low to form a perfect switch.The theoretical ideal would have been at the first dbl. bottom at 585.( dotted line). Out on the top, either because of the old support line, or RSI at 80 , or the right shoulder of the H&S, or even the short term divergence at the top. How many clues do you need?
Short entry as the price dropped through 607 or at the pullback at 608 for a rapid drop through the 100EMA and a follow down through the 10 point pullbacks to look for a bottom. 20:34 gave 3 peak div on ES Vol for an out around 570...assuming you had the stomach for the 15 point pullback just before...
Bit of a messy day, but a few points on the table.
Attachments
just a quicky
the overlapping nature of the waves is leading me to believe this whole up from fridat is a double zig zag or ABC coorective wave in a big triangle..IF IF IF that's the case then we should head for the lower trend line [pl.see yeserdays daily chart]...as wave E does its job
E waves are notorious for both under and over shooting their target,...under to catch would be longs off guard [they miss it] and over to gun the stops!
Attachments
Looking at monthly/weekly and daily charts of the Dow.What is evident to me is the amount of churning since last week Jan 2004.
Based on something I heard Mark Fischer say I suggest this. Over that period there is no one left to catch rushing for the door so who's going to do the selling .However,over that period there must have been ample opportunity for hedging elswehere against a blow off. So,if the hedgers come back now and create some 'false' momentum then we get a further push up to create a blow off. The blow off in excess of 200-300 pts looks necessary if only to make stocks 'cheap' enough again to recreate some further momentum. I might add this seems reasonable to keep equity growth within the statistical parameters of regression analysis.
How does that help us trade. Well given current high at 10700 + banged right up against previous resistance we shouldn't expect that high again. However, it's got to test 10650 to be a realistic presumption attracting buyers into the market. Given the scale of the blow off, stop sell at 10640 ish and stop loss at 10711. 70 ish points to swing trade over 300 pts and more RR if you scale in.
No indicators here just some regression bands and secondhand logic.
Anyone have a different view
Cheers
Last edited:
Hi Chartman, loved your Dow chart, I think you are right about the 10620 old channel support and the possibility of a break back into the old channel. I think we may get this on Wed 11th and I see a possible close of the week ( Fri ) at 10652 but after looking at your chart again I now see a stronger possible 10699 also for Friday close, lets hope the Eco/Data news out Thursday 12th at 1-30pm is good for us all .
Best Regards twiglet
Best Regards twiglet
tradesmart
Experienced member
- Messages
- 1,286
- Likes
- 22
Could be an Inv H&S in the making.....?!
The upward sloping consolidation over the last two sessions looks a tad bear-flaggish and could suggest a negative drift today with no significant data to inspire the market.....
$ weakening (again!)
The big market mover could come tomorrow imho when Sir G gets a chance to explain the meaning of "patient"....!?! 😆 :cheesy: 😆
Attachments
Newtron Bomb
Guest Author
- Messages
- 1,602
- Likes
- 87
Tradesmart & all chart posters
Can you please put your charts up with a white background as it make the summary printer friendly.
I can not convert the background with any degree of success manually like i do with CM's otherwise
I will endeavour to include the comments of others as requested.
I have not yet complied last weeks as i have been very ill all weekend
Thank you
& Good Trading
Newtron Bomb
tradesmart
Experienced member
- Messages
- 1,286
- Likes
- 22
NB - As/when I post charts and comments, they are only small snapshots of the action and of no 'summary' consequence. They are not intended, or are necessarily suitable for, any archive that others may compose.
Thanks and "wish you better’" 😉
Thanks and "wish you better’" 😉
Newtron Bomb
Guest Author
- Messages
- 1,602
- Likes
- 87
Tradesmart
It has been requested several time for me to include your commentary as people do find it very valuable.
If you think that something you post may be worth while for the summary can you post it with a white background.
Thanks
Mombasa & Tradesmart
Thanks for your well wishes, unforunately it is ongoing health problems & a few more days of suffering may be expected 🙁
May the spread be with you all
Newtron Bomb
tradesmart
Experienced member
- Messages
- 1,286
- Likes
- 22
Ok CM - will do.....
always suspected that my charts would cause trouble in the end..... 😱
.... 😆
edit - silly question has just occured - where do I find your email address.....?!
further thought:- is it possible to 'right button click' on the chart and 'save picture as'?
always suspected that my charts would cause trouble in the end..... 😱
.... 😆
edit - silly question has just occured - where do I find your email address.....?!
further thought:- is it possible to 'right button click' on the chart and 'save picture as'?
Last edited:
Dow today would have done almost nothing if it were not for just two 5 minute bars...15.40 and 17.55 UK time. Now if this was just Joe Public wouldn't you expect the distribution to be a little more distributed over time...any opinion out there on a plausible explanation for this scenario ?
Cheers
Cheers
Similar threads
- Replies
- 0
- Views
- 1K
- Replies
- 0
- Views
- 2K