You are using an out of date browser. It may not display this or other websites correctly.
You should upgrade or use an alternative browser.
You should upgrade or use an alternative browser.
tradesmart
Experienced member
- Messages
- 1,286
- Likes
- 22
I never know if my number is going to be "magic" until Friday......... 😆
Suspect that the magic (luck?) of last month won't be repeated for a while...... 😕
I sketched in some notional downlines over the weekend and it seems to like one of them as resistance at the mo'.....
After three down days, I was thinking that we might see some decent green today.........maybe later..........?!
Attachments
frugi
1
- Messages
- 1,843
- Likes
- 133
More shockingly, a bearish prediction from ChartMan! Never thought I'd see the day. But at least it provides an explanation for the mysterious tripling in price of Dow puts this morning. :cheesy:
This week Frugi predicts rising volatility and several sharp intraday reversals, perhaps betraying the formation of an intermediate top. But remember Frugi is strictly a contrarian indicator, to be faded at all times 😀
A test of 10564 or 10664 today doesn't look out of the question though.
This week Frugi predicts rising volatility and several sharp intraday reversals, perhaps betraying the formation of an intermediate top. But remember Frugi is strictly a contrarian indicator, to be faded at all times 😀
A test of 10564 or 10664 today doesn't look out of the question though.
frugi
1
- Messages
- 1,843
- Likes
- 133
10560 tested with PD as ES 10min 5 wave pattern completed around its S1 pivot. 100 EMA tested and cleared.
First crack at 38% rtr 10604 failed (next levels 10617 & 10630 if 10604 goes)
as ES struggled with its 38% and 25 EMA/10min.
Pullback to 100EMA again followed by more upside? This would fit with an ABC ES move, C perhaps ending around 1144 (61.8% and pivot) by the close.
Sheer conjecture! Stops to breakeven and wait for that 3pk ND methinks.
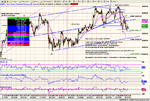
High in place at Thursdays' 10753.60?
Leg (i) down stopped at 50% retrace of wave (iii) thru (v)
(i) was retraced on friday to fib 50% at 10670'ish.
Is the next wave a (iii) or another i , ii combination?
For now we seem to be in a down channel!
However, several warning signals that Bears may not yet have taken over
Downtrend could be halted soon?
I see distinct PD in both CCI and RSI.
If we stay in down channel, my target for the next few days is ~10395 which is 1.618times length of leg (i)
We'll see soon enough.
Attachments
tradesmart
Experienced member
- Messages
- 1,286
- Likes
- 22
Just a contrarian thought, possibly premature; could the current pattern morph into a ‘W’ bottom with a target of testing 10750 again – every time it has made a new high recently, it has found a reason to go back and test it pronto……!?
Ps- the Nasdaq Comp is hell-bent on testing support at 2000 – will it hold….?
edit - Nice gap demanding to be filled 1150/1154 S&P....! (10min chart)
Ps- the Nasdaq Comp is hell-bent on testing support at 2000 – will it hold….?
edit - Nice gap demanding to be filled 1150/1154 S&P....! (10min chart)
Attachments
Last edited:
tradesmart
Experienced member
- Messages
- 1,286
- Likes
- 22
I see the triangle CM, and with the volatility over the last 3hrs or so, it had to be making one.....(you get to know the signs....! 😕 )
I fancy a break to the upside, but I'm a bull......most of the time...... 😎
(ps -heading north now in the last 15mins - they know how to time these breaks......!)
I fancy a break to the upside, but I'm a bull......most of the time...... 😎
(ps -heading north now in the last 15mins - they know how to time these breaks......!)
Distinct down channel in the making. 640 is a tad optimistic, but is supported by a "W" within the triangle.- Same target. CCI seems to like recovering off lows at -200 which is where we have come from. With +200 providing tops, it seems to be a good measure of what's to come.
Attachments
GruntnoWay
Active member
- Messages
- 159
- Likes
- 2
Chartman. Do you use CCI as a divergence indicator or just a break up through a level?
Opening triangle delivered to T1 , with a short entry on the pullback to the dropout, riding down to the double dose of PD to close at 560.That was the easy bit... taking a loon on the RSI break/Inv H&H gave a bumpy ride into the close, at one point falling back 35 points, but staying in the 100MA +/- 20 band. Tough choices....especially as the H&S recovered off the target at 580. Barely worth the wait or the struggle in the end.Those closing slope changes in support may lead to upside moves tomorrow.
Attachments
GruntnoWay
Active member
- Messages
- 159
- Likes
- 2
Thanks. Its one I have always struggled with. I will leave it alone then :cheesy: maybe its better for commodities.
I generally don't take much notice of CCI either way, but I saw tonight that the +/- 200 limits have contained all the price action over the last few weeks
CM, your quote above confirms in a way what I thought I had noticed namely that you do not refer to S/R lines and switches in CCI as often as before (say 3-4 months ago).
For the benefit of "your following", can you clarify why? And, if indeed you do not take much notice, why keep using the indicator?
My observation is that the indicator does show PD and ND soemtimes earlier than RSI and certainly helps confirm whether a reversal is or isn't "in the air".
Thanks
In the days when I used AIQ, their CCI @ 100 setting was superb. When I switched to Sierra, I found there was a difference in the algorithms between the two, used to calculate CCI. Since then I have never been convinced about the action on CCI. As you point out, SOMETIMES it works well. That infers that sometimes it doesn't.This I agree with. As time changes , the market changes and I discover new things, other things get left behind, like CCI. It's what I am comfortable with but it should not influence others in their quest to find something that they can work with. It may be that chosing a different setting for CCI may work wonders for someone else. I found that at 150 it was as close as I could get to CCI @100 on AIQ. This process of discovery cannot be done by just looking at today's 10 min chart. One has to build up a picture over a long time. RSI and ES Vol divergence proide me with everything I need and want out of a system, for most of the time.
Why do I keep it on my charts? Habit , I suppose, and maybe someone may see something that I don't.....
Why do I keep it on my charts? Habit , I suppose, and maybe someone may see something that I don't.....
tradesmart
Experienced member
- Messages
- 1,286
- Likes
- 22
Get’s a bit disconcerting when they start buying the ‘bad news’ (consumer confidence data) but the apparently ‘fake’ 70 point rally has been short lived and the true (down) direction has reasserted itself….!
RSI divs proving a good entry/exit indicators, but just trading by the 100ma rules would have brought good points so far today.
Looks like the indexes are at risk of a 5th session in the red……….(or will a hint of green prevail…..?! 😕 )
RSI divs proving a good entry/exit indicators, but just trading by the 100ma rules would have brought good points so far today.
Looks like the indexes are at risk of a 5th session in the red……….(or will a hint of green prevail…..?! 😕 )
Attachments
tradesmart
Experienced member
- Messages
- 1,286
- Likes
- 22
anyone playing 'call the bottom'....?! 😎
10525 ish for a bounce anyone.........?
10525 ish for a bounce anyone.........?
Similar threads
- Replies
- 0
- Views
- 2K
- Replies
- 0
- Views
- 2K