Dow Intraday charts 2/Feb - 6/Feb

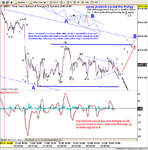
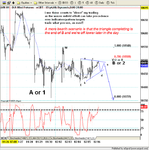
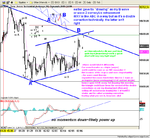
Still in the triangle like a coiled spring waiting to unwind – a big move is implied and direction could be determined by the NF payrolls numbers tomorrow or G7 at the weekend;but very hard to determine where the drift today might lead......

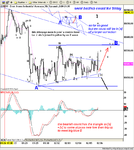
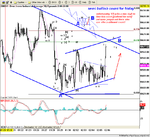
38.2% & 50% fibs have been tested, so maybe it’s the turn of 61.8%! – Interestingly around the level of Gordon Gekko’s Dow Comp entry……..!!

Some people just know…..
 

Attachments

  • 05-02-04.gif
    05-02-04.gif
    21 KB · Views: 580
hmm if you go with the theory buy on rumour etc sell fact they may well price in 175 payroll today and leave the index around 10550 and bigger expansion in the event of 175+ payroll.

jd..
 
More boring....... as TS says, a spring waiting to uncoil...
 

Attachments

  • dow 06-02-04 10.gif
    dow 06-02-04 10.gif
    32.7 KB · Views: 475
Another nothing but whipsaws day, except the one move to 520. Triangle break with target of 510/520 and 3 pk nd top, but not before 50% of your profits gone on the middle trough. With such a narrow range,and res. at 520, maybe it would have been more prudent to take what was on the table at the first peak at 510....
 

Attachments

  • dow 06-02-04 1.gif
    dow 06-02-04 1.gif
    28.2 KB · Views: 510
UK 13.30, 150k exp. Also average earnings 0.2% exp. ave working week 33.7hrs prev. unemployment 5.7%exp.
 
Good to have it released before market opens. I hate those 3pm announcements and market reversals.
 
any other elliott people here?

alternative count/view?
 

Attachments

  • snapshot-34.png
    snapshot-34.png
    48.5 KB · Views: 385
Wellshot - we might all become Elliot people in due course, influenced by your excellent posts - I'm not quite ready to offer alternative wavecounts just yet though...... :confused:

I revealed my trading plan at the beginning of the week – that I would be trading to Gordon Gekko’s Dow Competion Entry – and I love it when a plan comes together..... :cheesy: !

On a simple t/a note, that huge triangle is about 220 high measured from the start of ‘Fed news’ fall to the lower level at 10420, so when added to the triangle break out point at around 10480 gives a target of….?….what a coincidence…..!!

But there could be resistance before we get there, not least the G7 meeting at the weekend…….
 

Attachments

  • 06-02-04.gif
    06-02-04.gif
    28.4 KB · Views: 344
Hi Wellshot,
This is the intraday comment I just received from an Elliott analyst:
Quote
The rally in the Dow proved that the earlier proposed “B” wave triangle formation is not the pattern playing out. Instead, today’s push above the 10,568 peak suggests a flat correction is unfolding that has the potential to reach 10,598 before wave a=c. That is, the current strength is now being counted as a “c” wave of a flat within a larger wave “B”, or potentially wave 2 correction, that has some potentially serious downside implications over at least the near-term. For our purposes though, we will be looking for the initial signs of weakness that suggest this strength has peaked and that a turn is at hand.
Unquote

To be honest I have lost track a little and try to concentrae on what I see and that seems to be a flag although rise in past few minutes doesn't seem very convincing.

Separately, I see you use eSignal and wondered how one draws all these need lines. I have only been able to find the standard thin lines. Your analysis looks excellent but appears like a lot of work to prepare. Are there any (graphics) shortcuts?
thanks
 
Different view, different comment - about the same conclusion…….!

A slightly compressed view of the extended lower consolidation on the 10 min chart shows an apparent ‘W’ bottom with a target of 10720………

Maybe confirmed as the price has now broken above the central apex…….

speculation.....speculation......
 

Attachments

  • 06-02-04a.gif
    06-02-04a.gif
    22.2 KB · Views: 323
TS

Can you explain how you came to the figure 10720? in numbers e.g add 10??? to 10 ???

Thanks


Kathy
 
TS , indeed a very fat bottommed W. I think I am coming around to to your view. The flag on the 10min chart (with a pole of ~130pts) also potentially targets 10720'sh.
 

Attachments

  • 10mindow.png
    10mindow.png
    91.6 KB · Views: 286
rusticKathy - I added the height of the 'W' - about 150 - to the top of the apex - at 10570.......

none of this is rocket science though (you realised? :D ) and any result can only be regarded as 'notional'....!

for my part, I place greater emphasis on Gordon Gekko's Dow Comp Entries........... :cool:

edit:- Bgold - I'm seeing slightly different things in different chart timeframes (as you do!), but my overiding conclusion is that we have short term support around 10420/50, which may form a base for a move higher....

Regards
 
Last edited:
Top