Dow Intraday charts 2/Feb - 6/Feb

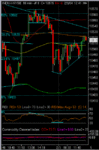
Humph……not quite the day it was yesterday, but the ‘sideways’ day trading system is working well for a few points, just buying and selling on PD/ND…

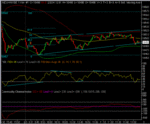
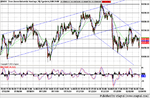
I won’t try to predict today’s outcome, but the Nasdaq Comp is making a nice triangle on the 10min chart, and I figure it may want green in anticipation of CSCO earnings after hours – and after 5 consecutive red days! (might drag the Dow up!)

But any +ve predictions may be thwarted by the weak $/ Ricin fears…..

JSD – pattern recognition:- might be a “cup & handle” – I’m a bit reluctant to spot them as when I’ve done it in the past, the handle has fallen off…….. :confused:
 

Attachments

  • 03-02-04a.gif
    03-02-04a.gif
    18 KB · Views: 514
JD

Im just making a point you dont need charts to make money form the marlet did the great Jessie livermore have a PC with him when he was scalping, no he just had a tick by tick price of numbers to watch.

I have studied Gann eliot and most complex trading methods out there but come with the conclusion to make money keep it simple

But jd You missing the point you all looking at the same charts same indictors and so on what the pros call the public when these big fund need to move money out of the market the public helps them they now what you looking at when all you indictors are pointed up there are plenty of buyers around (the public) when the big funds see this they start to move they money out of the stock because when they selling they need buyers.

CJ
 
but Jessi Livermore died broke, but thats a different story:)

but why does the market go up when my charts point up. Is it because I have special charts? No, it because I interpret a chart differently to some other guy like Im sure you interpret ticks in you head a different way to another guy.
 
Looking more bullish now…..the triangle has a target of 10560 ish, and if resistance there is broken it could mean a good move up…..

No dead certs here though……. ;)

edit: Mom, clearly a matter of interpretation...... :cheesy:
 

Attachments

  • 03-02-04b.gif
    03-02-04b.gif
    14.7 KB · Views: 457
good call TS - spotted that price / rsi was very weal on down move so closed short. Now long.
 
It's struggling to stay in the bottom of a channel..and on a 60 min chart it looks down all the way to me..it's got to go through resistance not far above this which makes it a 'bad' long..I would only want to short this
Cheers
 
Last edited:
Chump,

I agree it looks like more of a wedge then a triangle.......also forming the right shoulder on the 10 min chart????
 
Well, the handles falling off the cup, so maybe H&S wins for now....!

time for a bit of recovery before the close......?!

rusticKathy - you're right about CSCO....
 
Been in and out and made a loss. Closing shop for the day. Who cares if it doubles from here.
 
After the big moves yesterday maybe it was inevitable that we would have a sideways/consolidation day today I guess……..!

I suspect that in the end, the weak $ and Ricin fears scuppered any prospect of decent gains……

I got on reasonably well taking small trades on PD and exiting on ND (you have to put blind faith in it!) – only came unstuck once at 18.30 ish when the PD at 10510 only produced a rise of 12 points, so had to abandon ship pronto; but should have seen it coming being so close to resistance at 10530 (38.2% fib of the recent 10700-10420 move)

Some professionals are still bullish:-

Bob Dickey, technical analyst at RBC Dain Rauscher, said the ability of the Dow Jones Industrials Average and the Nasdaq Composite to hold above support at 10,400 and 2,000, respectively, despite a number of negative technical signals was a positive for the market.
"The longer that these levels hold, the more meaningful and important they become on a technical basis," Dickey said. "We believe that another two weeks of holding above support would be enough time for a consolidation to lead into another more bullish period."
 
In all the years I've been studying the Dow, I can only recall seeing one vague resemblence of a cup and handle. Every instrument has it's own characteristics and a C&H is not one that belongs to the Dow. As far as I know.....
 
So no move to 600, but horizontal resistance has set in at 520 ish. If the triangle breaks to the upside, it's target is 610. A break to the downside = 390.Either way, does that move us into "sideways mode" between those two values?
 

Attachments

  • dow 03-02-04 10.gif
    dow 03-02-04 10.gif
    34.7 KB · Views: 545
Looks like TS got it right today. Playing the PD/ND was a good choice.... Does the bull flag at the close mean much? What's the target?
ES futures down 3 right now...
 

Attachments

  • dow 03-02-04 1.gif
    dow 03-02-04 1.gif
    29 KB · Views: 578
To much pullback 2 qualify for a handle. Max pullback is a third of the right hand side of the cup
 
should be more range opps today hopefully, test of 10400 possible keeping an eye on nasqaq 100 at 1474 if it stays within that as low then 1500 not undoable.

JD
 
TS

Your call on the 10 min channel last week has performed perfectly, are you related to Alan Greenspan ????????????? :cheesy:

Was that an old family photograph you posted last week????? :cheesy:
 

Attachments

  • snapshot-2.jpg.png
    snapshot-2.jpg.png
    120.9 KB · Views: 450
Top