You are using an out of date browser. It may not display this or other websites correctly.
You should upgrade or use an alternative browser.
You should upgrade or use an alternative browser.
CM
Thanks for the example of the pole & flag I am far too embarrassed to post
on the T2W board but I still can not see the target of the example. When you
get a moment could you do a double dummy guide. I know you are busy so please do not rush to do it.
I feel that if I can start to see the targets it will help me. I did spot
the PD though!
If anyone else can help me please do
Big Thanks
Kathy
tradesmart
Experienced member
- Messages
- 1,286
- Likes
- 22
One Eyed Shark
Well-known member
- Messages
- 257
- Likes
- 13
Oarsman
Agreed, 550-60 has provided strong S/R through Jan also 580-90 my money is on both being taken out on the long side by the close
Agreed, 550-60 has provided strong S/R through Jan also 580-90 my money is on both being taken out on the long side by the close
tradesmart
Experienced member
- Messages
- 1,286
- Likes
- 22
rusticKathy – it’s covered over 200 points today in two decent moves, so it’s consolidating now imho – I’ll take a position when it breaks the range…
It’s also near the top lines of the downtrend channels that I put on the 10/60min charts earlier…….
I’ve got a suspicion that it wants to get into the 10600’s again and maybe test 10700 (but not today! 😉 )
edit - those top downtrend lines certainly worked - confirmed now - down she goes!!
It’s also near the top lines of the downtrend channels that I put on the 10/60min charts earlier…….
I’ve got a suspicion that it wants to get into the 10600’s again and maybe test 10700 (but not today! 😉 )
edit - those top downtrend lines certainly worked - confirmed now - down she goes!!
Last edited:
tradesmart
Experienced member
- Messages
- 1,286
- Likes
- 22
Hooya – this thing has got such a big range that it can be hard to speculate – another 100 point move down since 19.30!! – it’s confirmed resistance at the top line of my notional downtrend channels and the bottom lines are at below 10350…!
But it’s also made a higher low on the 10min chart so 10700 could still be within reach soon imho……
but I'm a bull....... 😀
edit - CM - is there such a thing as a rolling bottom?!
EDIT. Couldn't resist this.... Yes there is, my wife has one.
CM :cheesy: :cheesy:
CM - always suspected that you were the man who had everything.....! 😆
another thought with reference to the 10/60 min charts - I suspect that the rounded formation could be the head of a developing Inv H&S..........?!
speculation......speculation......
Last edited:
One Eyed Shark
Well-known member
- Messages
- 257
- Likes
- 13
I think we have the US Treasury to thank for that climax to the day.
Thought we were printing an excellent bull flag from 18:30 and was preparing for the final push up, then the spike at 19:25 gave us a clue of what was to come effectively giving a double top and the ride down.
Just shows you need to be flexible in this game and not get wrapped up in your opinions...................roll on another day like this tomorrow 😀
Kathy , here is the target theory for flags. In the diagram I have shown a Bull Flag and a Bear Flag. The sums are the same, but you have to do " takeaways" for the Bear Flag.
Assume the base line is at 000. The length of the pole is 45. We now get a period where you will usually see 3 cycles running between the two parallel down sloping lines. These are the SR lines for the flag. As soon as the first cycle completes, you will know the SR values so you get the value of 15 pretty quickly.By the time the second cycle completes, you can now draw in the "estimated" two parallel lines.From the timescales involved ( minutes to hours/days), you can extrapolate where the 3rd low will be, both in time AND in price.In this "text book" example, we see that the third low occurs at 30. To get our target, we add this pullback value to the pole length, so we get 30 + 45 = 75. This is our Target and we expect the price to get there. Mostly, the momentum will follow the original pole, so we end up with the pole and extension being roughly parallel. We can now track our price against this line. Mostly, hopefully, the target will be met, ie the price will reach 75. As a rule of thumb, allow for a shortfall of 10% in the pole length, in this case 4.5, when deciding if the target is MET or not. If it is met, start looking for clues as to where the next target could be.......
From the diagram, three things are clear:- The shorter the pole length, the LESS the REWARD there will be in the trade. The deeper the 3 cycles, the LESS the REWARD,the steeper the down trend of the 3 cycles, the LESS the REWARD.
Clearly the optimum entry point is the trough on the third cycle.This is the MOST RISKY as there is no guarantee that the flag will break to the upside, yet alone meet the target.On the other hand, you have to balance this against this being the closest you will get to a stop loss, as you will exit if the price then breaks the lower sloping support line. Absolute stop will be at the base line price of 000. In this example ,that's 30 points away! Taking the 3rd trough has another advantage when using SB's. The bias will be in your favour as , in theory,you could get a price of 25 before it turns round and goes North.
Final point, expect a pullback of 20 odd points at or near T1. This, in theory, should give you your next target. Use the same sums and principles to arrive at T2.
Attachments
Yes, another ton, TS but not in the right direction. Still, we're seeing great volatility. I wonder how much the Forex guys moved today?
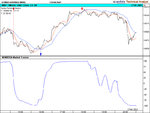
I like the 10 min chart.... expanding triangle on RSI could lead to a big move tomorrow. The sums come out at 600 on RSI strength. Looks like the new trend lines a showing a simple correction so far. Not sure about the 2 lows at 420 and 440. Are they spurious?
I like the 10 min chart.... expanding triangle on RSI could lead to a big move tomorrow. The sums come out at 600 on RSI strength. Looks like the new trend lines a showing a simple correction so far. Not sure about the 2 lows at 420 and 440. Are they spurious?
Attachments
GruntnoWay
Active member
- Messages
- 159
- Likes
- 2
The swings were good today. Been an easy trading day. Very happy. What will tomorrow bring :cheesy:
Plenty of interesting things today, especially the number of points on the table! 250 ish.... :cheesy:
Short on the open triangle break at 500 ish
Cover and Long off the PD + double bottom at 440 ish.( Div ES vol too.
Close on the eventual PD top at 566.
Short on support fail and pullback at 540.
Cover on the blow off bottom at 470.
More than enough....
The "W" bottom at 436 had a target of 456.
TS - I've never noticed or thought about a "rolling bottom",but it certainly looks right....New technical term.. TSRB. :cheesy:
Attachments
GruntnoWay
Active member
- Messages
- 159
- Likes
- 2
Similar threads
- Replies
- 0
- Views
- 3K
- Replies
- 1
- Views
- 409
- Replies
- 10
- Views
- 3K
- Replies
- 0
- Views
- 2K