Dow Intraday charts 2/Feb - 6/Feb

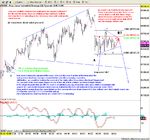
OES – I have to own up – in the Greenspam family we have a keen eye for trendlines – Uncle Sir G. is working on some trendlines for interest rates at the moment and I can reveal quietly…… (shhhh - don’t want to spook the markets….!) that they’re not going down….!

As for the photograph – for me, it's just like looking into a mirror…….. :eek:

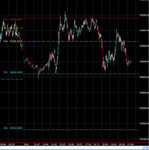
Ps - Trading’s going well today just working to the PD/ND – it works for me…! (nice move when the +ve data came out at 15.00 :cheesy: )
 
Nice flag in 5 minute dow developing need the green turtles head to be nudging 507/10 for continuation upside @10498
 
One eye, looks like a triangle to me.

Waiting to see which way it'll break. Thought it was abt to go but not quite - or maybe it just a puulback to the upper trend line (of the tri)
 
ndx100 firing up a bit holding its break, spx stuggling on the line
 
Triangle formed on the 1min chart with a theoretical target of 10540, but I don’t know if it can perform with the Naz stuck in such a deep funk….! (S&P mired in red too..)

I’ll probably stay out ‘til the evening session now – that 70+ spike up at 15.00 provided enough excitement for now……!
 

Attachments

  • 04-02-04.gif
    04-02-04.gif
    18.7 KB · Views: 512
hmm yeah at least prices are holding at the top end of the spike seems like the ndx100 needs to be trading through 80/2 for momentum.
 
have to be careful not necessarily today but in general. If the dow is just waiting for compx to bottom when it turns back up the dow will pile on the points. It happen before Christmas, the dow just rode it by going sideways.
 
Anyone interested in the implications of island reversals and gaps? - the Nasdaq Comp 10min chart is riddled with them at the moment..

Doesn't seem to affect the Dow so much....

Suspect the Naz and S&P might recover a bit by the close - pure speculation tho'.......
 
PD on the 10min charts Naz Comp/ S&P now - I don't know if it will have time to give some recovery by the close.....(and drag the Dow up too.......!)

edit 21.06 - could have had +35 when it rushed up to 10500ish, but watched for a bit too long and was lucky to get +20!!!..... :confused:

futs now down to 10460 - we're definitely in a downtrend.....
 
Last edited:
Today has validated the two earlier discounted lows. Now we have a solid support line.
 

Attachments

  • dow 04-02-04 10.gif
    dow 04-02-04 10.gif
    39.9 KB · Views: 441
Hmmm recent ranges tighter than a nuns ying yan, still looks like the upside break of the trend line 10500 might pop us back into the upper channel tomorrow, hopefully the nasdaq wont be acting like lead wellies on the dow tomorrow, the dow put in a sterling perfomance relative to sp and nasty naz though.

hands up for a nice 150 point rally, although the deficit issue has to limit the upside i dunno maybe people will think sod it and ramp it up a bit more take out 10700 then sell it to death @ 11000

jd
 
Another day for playing divergences...and not a lot else.
 

Attachments

  • dow 04-02-04 1.gif
    dow 04-02-04 1.gif
    29.4 KB · Views: 410
Just out of interest the ym traded well around the pivot points today.
Regards mark
 

Attachments

  • dow.jpg
    dow.jpg
    70.1 KB · Views: 360
Well today at this point anyway the market looks set to open 10485 give or take 5 either way which will set up us for a look at 10500 soon after open, now thats the down trend line from 10700 so we will be into the business end of a triangle more or less from open, should be interesting. The nasdaq looks like intially trading towards 1474 , but has the sell off point 1482. be interesting to see if it makes it that high or is limited to the 1474 if it trades back through 1482 i think there will be quite a bit of short covering which may help the dow which i assume will be at 10550/60 when NDX is at 1482.

hmm unless we churn yet another day 10440/10520.

JD
 
Marky

Which pivot point calclator are you using?
Pivotpoints.co.uk & Stelaronline are identical but differ from your calculator, any idea why?
 
a few thoughts

these are only my musings in very little real detail=more an overview....trade what you see we all can only ever learn by our own mistakes..God knows i've made them all..but if its of interest....
 

Attachments

  • snapshot-29.png
    snapshot-29.png
    59.4 KB · Views: 321
Hi SallyT , not sure why they are different, maybe mines wrong who knows, the tool i use is an add on for tradestation, i find most days there not far out.

Regards mark
 
elliott

i know elliott is perplexing [!] the current larger degree count is subject to much debate among "elliotticians"..any views on my view here?
i still can't see whether we need another up retest before a useful 2 month down/sideways correction or that [according to this count] the tops in and we're in the beginnings of that major 4th now.
usually there is the need foe the macd to reset at the zero line for the 4th to finish with a major divergence then with any new high the fifth may put in [see them all the time on the 1 min charts as shown brilliantly by tradesmart and chartman]
thats there is yet no ND has many saying big up to come but are we jumping the gun and looking not to give this 4th or X or D its chance to unwind the huge "up" since march last year?
also the leg up from december has [iii] extended which will usually have 4 double retraced==i.e. we need one more push up at this lesser degree [as marked] to finish 5 THEN down
any thoughts?
 

Attachments

  • snapshot-30.png
    snapshot-30.png
    44.5 KB · Views: 283
Top