Dow Intraday charts 23/Feb - 27/Feb

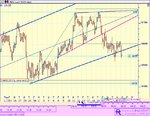
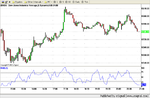
Aye what a dull day. I'd have been happy with 35 pts but perhaps I have modest aspirations (=inept intraday skills!). Reckon we'll see some superior movement tomorrow though, which I suspect will be up as long as ES can break 1145/6 trip top / angry Pitbull 10 day ema / inv H&S neckline and the Dow the top of your downchannel 10600-625ish.

Been nicknamed Frugi since I was a nipper; nobody really knows why, just one of those tings which arbitrarily stuck. It rhymes with boogie and comes from Latin 'frux' pl. 'frugi' = "fruits of the earth" so I'm happy to think of myself as harvesting fruits from the market or something equally pointless and probably egotistical.

Funny how being in profit, patiently stalking a target that is a mere probability, makes the heart flutter more violently than when approaching a concrete stop loss. For me at least, taking losses is easy, but holding open profits provides the sternest of tests. Who needs hamster wheels and mirrored walls for cardio exercise indeed?!

PS ChartMan, sorry for irrelevant posting! Plz feel free to delete obviously.
 
Last edited:
Traded the Eur/$ futs contract for 1 hours this morning and found 60 points, traded the YM futs contract for 6 hours this afternoon and found 20 points ..............

All love affairs come to an end sometime................ :cry: maybe time to change my screen name from OES to OE$

"This has been hard work today"
 
No prob Frugi.
Channel breakout, just , and divergence holding with a slop change.Following on from the CCI +/- 200 , there's plenty of room for up.
 

Attachments

  • dow 25-02-04 10.gif
    dow 25-02-04 10.gif
    31.2 KB · Views: 515
Barely worth a word.... maybe we should all pop over to FX. OES did well with 20 ....
 

Attachments

  • dow 25-02-04 1.gif
    dow 25-02-04 1.gif
    25.7 KB · Views: 521
I think this 61.8% level is crucial. If it fails it's fresh air down to the low 10400s.
 

Attachments

  • indu.jpg
    indu.jpg
    79.3 KB · Views: 435
Quite a nice obvious ‘W’ bottom on the 1min chart with an immediate target of 580, but the top downtrend line is only a bit beyond, so maybe contact will be made…..?!

I’m holding long from 543 in hope of some more upside, but if things go pear shaped I won’t hesitate to pull to lock in a small profit……

One thing is for sure – you can’t win ‘em all……… ;)

edit:- 17.26 - possible 'round trip' to 10600+....?
 

Attachments

  • 26-02-04.gif
    26-02-04.gif
    17.8 KB · Views: 431
Last edited:
Nice run up to 610, and was grateful to abandon ship at that level…….

No position at the mo’ – too many conflicting signals, but the current geometry suggests yet another possible ‘triangle alert’ and more sideways volatility ahead…….. :confused:
 

Attachments

  • 26-02-04a.gif
    26-02-04a.gif
    15.1 KB · Views: 388
TS - I made the mistake of closing my long at the 3PK ND between 16.00 & 17.00 - well, I thought it was ND.

Just as well I didn't go short .......

Nicely played BTW, I've gotta learn this patience thing !
 
Mom – yeh, these hints of ND don’t seem to count for much when it’s trending strongly north – RSI strength and rising CCI kept me in, and as noted earlier, I suspected that it had a date with that top line and whoosh when it went through…!

Would have been a decent short down from 610 in retrospect, but greed is the enemy and all that……….. ;)
 
I'd call that an RS switch on the price, but no sign of it on the indicators....The first Inv H&S off 520 failed, maybe this one will go... target 620. So if 620 goes, you know where next.
 

Attachments

  • dow 26-02-04 10.gif
    dow 26-02-04 10.gif
    36 KB · Views: 346
For those that gambled on the open, or took the pullback,the target of 558 was comfortable met, leading to a double bottom and long of the PD. "W" Target 580... but it took 3 goes. At 80 onRSI it haad to be an out as TS found... A short as 600 failed was a sensible choice with a cover on the long PD, and with RSI at 22, worth a stop and reverse.
 

Attachments

  • dow 26-02-04 1.gif
    dow 26-02-04 1.gif
    22.2 KB · Views: 362
Good Morning Everyone

A bit of help needed again I am afraid. I have been using a 3 min chart ( a bit safer for me) but I can not get the settings correct for RSI on the usual 14/1/70/30/1 you do not get the PD & ND signals, like on the 1 min obviously.
I have tried playing around with it a bit but not yet found the right numbers. Any ideas?

Thanks

Kathy
 
Kathy, TS = Tradesmart :)

TS - Looking at it again (CM's chart) , It wasn't really ND as i thought at the time. Figment of my imagination.
 
Rustic
you need RSI = 5 ( 14/3) to show the divergences that appear on a 1 min chart
 
CM

RSI settings

14/3/70/30/1 do you mean? it still does not give the same readings as on the 1 min chart, have I done it correctly?

Thanks

Kathy
 
Last edited:
Rustic

It depends on which charting package you use but I would think the settings should be 5/70/30

The 5 is the period of time you are charting i.e. a setting of 5 on a 3 min chart covers 15 minutes ( 5x3), compared to a setting 14 on a 1 minute chart that covers 14 mins ( 14x1)

70 is the upper band position

30 is the lower band position

I have attached a 3 min chart with the right settings so you have something to compare it to
 

Attachments

  • snapshot-2.jpg.png
    snapshot-2.jpg.png
    51.4 KB · Views: 253
Big Thanks OES for the chart.

I am using Sierra charts. the usual settinga are 14/1/70/30/1

So would the new setting be 5/1/70/30/1 or do I put in 5/70/30?


Thanks
 
Top