You are using an out of date browser. It may not display this or other websites correctly.
You should upgrade or use an alternative browser.
You should upgrade or use an alternative browser.
tradesmart
Experienced member
- Messages
- 1,286
- Likes
- 22
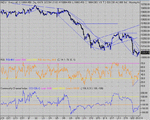
Going back to 15/12, there was a strong upside reversal around 10025 ish, so a number to watch imho.......
tradesmart
Experienced member
- Messages
- 1,286
- Likes
- 22
Chaps, am looking to go long at close and holding overnight based on following :
- RSI div on daily charts
- RSI div on 10 min
- divergence between 60 min and 20 EMA is to big - price should move to close the gap a bit.
But, it could all change in the next hour.
- RSI div on daily charts
- RSI div on 10 min
- divergence between 60 min and 20 EMA is to big - price should move to close the gap a bit.
But, it could all change in the next hour.
tradesmart
Experienced member
- Messages
- 1,286
- Likes
- 22
Mom – same thoughts as myself – a bit wary about the futs tho’ – when the market is depressed they often do their own thing and tank overnight; possibly taking out your stop, even thought the cash has closed pointing up…….
Just one angle I’m taking into account….(but good luck anyway……! 😀 )
Just one angle I’m taking into account….(but good luck anyway……! 😀 )
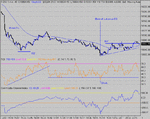
Middle of the road divergence coming good after 45 mins. No usual Vol div on ES, so a bit hit and miss, but failing to make 32 did help. Uneventful day generally, save the huge vol spike on ES at 19:08 to confirm a bottom. Not that there was much reward to follow as the price kept banging at 64... Could be a triangle with 100 target as the price closed on 64 having tried to break out.
Attachments
Indeed H&S but not reverse! Clear on the 1min DOW targetting at least 10070 (reached as I write this). Also noticeable ES and NQ failed to make new HH's.
It took a while before ND's in indicators confirmed topping process. Curious to see where this ends. I read some Elliott wave comments that the final 5th leg down of highs in DOW is projected at ~9945
It took a while before ND's in indicators confirmed topping process. Curious to see where this ends. I read some Elliott wave comments that the final 5th leg down of highs in DOW is projected at ~9945
tradesmart
Experienced member
- Messages
- 1,286
- Likes
- 22
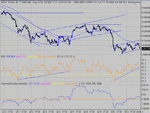
Yet another triangle as Mom says, and in the construction it produced some clear tradeable signals on the 1 & 5min charts today……..
Triangles on the COMPX and SPX as well…….!
I’m inclined to suspect that the Dow would like to test 230 soon, but that said in the knowledge that the futs are now dropping below the close price, and that it hasn’t given 10010 a second test…….. 😕
Triangles on the COMPX and SPX as well…….!
I’m inclined to suspect that the Dow would like to test 230 soon, but that said in the knowledge that the futs are now dropping below the close price, and that it hasn’t given 10010 a second test…….. 😕
Attachments
tradesmart
Experienced member
- Messages
- 1,286
- Likes
- 22
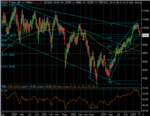
We're around the 23.6% fib retracement point of the 1 year bull run now, and I note that the 38.2% point coincides with the 100ma in this timeframe........
(not that I'm drawing any conclusions from this...honest....! 😉 )
edit - the 'top' that we've just had at 10750 ish is noticeably broader and drawn out compared to the others in recent years..........any significance I wonder....?!?
(not that I'm drawing any conclusions from this...honest....! 😉 )
edit - the 'top' that we've just had at 10750 ish is noticeably broader and drawn out compared to the others in recent years..........any significance I wonder....?!?
Attachments
Last edited:
Similar threads
- Replies
- 1
- Views
- 2K
- Replies
- 3
- Views
- 2K


