You are using an out of date browser. It may not display this or other websites correctly.
You should upgrade or use an alternative browser.
You should upgrade or use an alternative browser.
tradesmart
Experienced member
- Messages
- 1,286
- Likes
- 22
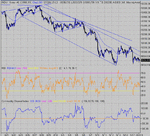
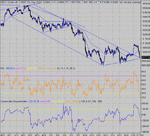
Very likely that yesterdays erratic action was a low-level bull flag in the making; as shown on the 5min chart, and the futs are up this morning in the hope of a breakout.......
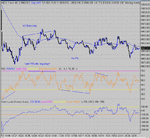
Nice PD developing on the 60min chart over 7 days seems to confirm that maybe we have a broad enough bottom to build on after the recent declines......
You know the old traders saying "the bigger the fall, the broader the bottom"...........! 😉
(but don't casually mention rolling bottoms as it has a strange effect on CM....!?! 😆 )
Attachments
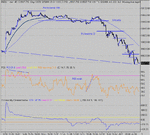
The ND is normally only a signal to close a long. It's rarely a signal to go short as well ( flip trade) . Patience is required to find ( if it happens) a short entry. It is often the loss of 100MA with a pullback. Right now , that's about 9950 ish. To take another long, we need a break of 9980, and then the ceiling is likely to be a rocky 10K....
Cheers CM
One more question if I may. Do you use risk/reward ratio. I try to use a minimum of 2 to 1 but not always possible and maybe I attatch to much importance to trying?. See what you mean about pull backs even though RSI was oversold at 18.00 just after the Dow touched the MA. A good entry level with little risk if I have understood what you wrote earlier ?
One more question if I may. Do you use risk/reward ratio. I try to use a minimum of 2 to 1 but not always possible and maybe I attatch to much importance to trying?. See what you mean about pull backs even though RSI was oversold at 18.00 just after the Dow touched the MA. A good entry level with little risk if I have understood what you wrote earlier ?
Last edited:
Who knows what the reward/risk ratio might be.... But there are times when it is more prudent to wait... That possible long entry on 9980 break with 10k as tops would have been a big gamble. Not a risk as such, but little chance of it flying through 10K. As you can see, it made 9987. So it would have made more sense to wait and see if 10K went. And even then I'd want to wait for a pullback for confirmation. If you must take gambles ( and we all do for one reason or another from time to time) take a small stake.... I much prefer to take a trade and manage it, calculating targets and moving with the flow, rather than trying to analyse what the reward /risk might be at a particular point in time. Right now the market is intent on gapping ( a bit ) and going sideways so trading is hard and risky ( less so for direct access).
It is clear that the most common moves seem to be between the "magic numbers" 0/32/64/0 and from those, one can get excellent R/R entries. Triangles and flags offer similar opportunities. I would say it is far more important to squeeze the maximum out of a winning trade (and I've shown you all countless times how to do that ) and to cut your losers as soon as it hits you that it is a loser- and that I can't show you how to do. You must have realised that to take the 9980 break, the lose position is after it fails to make 10K i.e. heading back to 9980 and below. Those that wait and see if it tries for 10K again are living very dangerously indeed.They tend to wait, and wait a bit more, and more still and then find they can't close the trade because the loss is too big to take. Then they look for a bottom and a turn around, where they can add to their loser......
Does that sound familiar to anyone?
ChartMan said:see if it tries for 10K again are living very dangerously indeed.They tend to wait, and wait a bit more, and more still and then find they can't close the trade because the loss is too big to take. Then they look for a bottom and a turn around, where they can add to their loser......
Does that sound familiar to anyone?
Only too familliar I'm afraid 😱
tradesmart
Experienced member
- Messages
- 1,286
- Likes
- 22
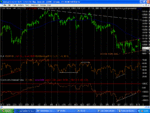
No ND that I can see....
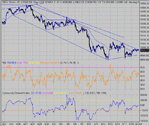
And we got the 10K break..... and promptly lost it again, eventually. Still, I'll stick my neck out again and say we're going back up tomorrow. RSI is well into O/S at 20 and the price sitting right on support pullback- RS Switch.
And we got the 10K break..... and promptly lost it again, eventually. Still, I'll stick my neck out again and say we're going back up tomorrow. RSI is well into O/S at 20 and the price sitting right on support pullback- RS Switch.
Attachments
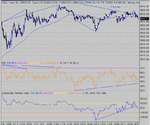
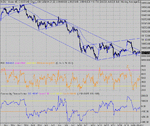
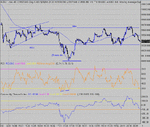
Note, on the way up, the pullbacks don't violate the prior high.On the way down, very similar- the pullbacks don't violate the prior lows, until the end of the move.The gap up and gentle curve towards the top signals an extended sideways breather while things settle. NO point in trying to trade here after these type of opening plays. You should concentrate on where your next sensible entry will be, both long and short. Long will be the 100 break+ pullback, short will be the loss of 64..... which in this case was a false start, BUT was only a 10 point or so draw down. Well within the 20 point stop loss margin... You know the short was a loser if the price broke back through 80 ( Higher High). Taking the short was a nice swift 100+.
A good example today, of how to manage your trades through simple higher high/ lows on the up, and lower highs/lows on the way down. The max stop of 20 never came close all day... assuming you didn't go short at the open!
PS oops! missed the 3 PD out at 9955....
A good example today, of how to manage your trades through simple higher high/ lows on the up, and lower highs/lows on the way down. The max stop of 20 never came close all day... assuming you didn't go short at the open!
PS oops! missed the 3 PD out at 9955....
Attachments
Nice one.... 3rd support so it's crunch time....Finirama said:Looks a bear flag forming on the 60 min chart?
Possible support/ bounce of 9,900 to take us back upto 10,100 before the break down??

