You are using an out of date browser. It may not display this or other websites correctly.
You should upgrade or use an alternative browser.
You should upgrade or use an alternative browser.
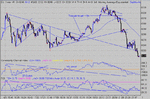
Some decent points to be had today, along with a few boring bits, with a nice surprise at the end 🙂
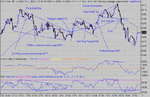
The early bull flag at 15:00 signalled a good entry on the break but soon became quite volatile, requiring a sharp eye to get out and short before taking on the "safe" long ( 3 options around 8020). The triangle set the target for the rise to 8090 which was duly delivered and also set up the firs part of the Negative Divergent top. As it turned out , there were multiple exits possible here, all within a few points..... ending with the fourth peak.
The safe enrty short was soon confirmed after that and a rapid drop to 8025 followed. The only cluse for a possible early exit here was the RS switch in CCI and RSI.
Attachments
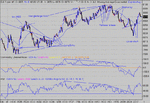
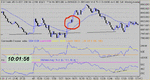
Chartman, I was referring to Tuesday's chart and I meant US times.
Looking at your 1 min chart it looks more like down-sloping expanding triangle than a bull-flag ( I was using a 5min LYCOS chart). Interesting how things appear different at the time - I think it is very easy to see what you want to see with TA patterns.
Anyway I think the play was still good. The pattern I was looking at was from the high of 8100 down to 8025. It eventually broke above the upper trend line came back to touch it then shot up to 8080 before the market closed. I think this break & re-test was a reasonably entry point. Interestingly it coincides with a break & retest of the 100 ma at the same point although it was still within MA + 20, so may not have been a good entry using your criteria.
Your comments always welcome.
Dino.
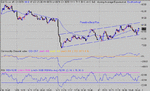
Doh. That's what happens when the feed screws up and I have to reset everything🙁 Here's the chart again with 100 EMA correctly shown....
If nothing else, it goes to show that chosing a value for an indicator is largely unimportant..... which is something I've always thought.
If nothing else, it goes to show that chosing a value for an indicator is largely unimportant..... which is something I've always thought.
Attachments
Olwen yes it was a bull flag but it failed, breaking to the down side. It stll has a target and the resultant drop failed to make it, as did the pullback target in the middle of the drop. You should have expected a rise from the third low, instead it dropped straight through.
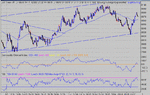
I said earlier today in the chat room, be patient and wait for something to develop in TA to get some pointers as to where we were going. That eventually developed, givig three separate targets between 8305 and 8310.
The triangle, then the bull flag then the pullback. All went well till 8310 ...... then you should have spotted two things developing.
1. A possible H&S developed.This got "cancelled at 20:09 as the price pulled away from the support line drawn in....( 8301 was the target).
2. The peak at 8317 should have got you looking for possible divergences setting in, which there was, in both CCI and RSI.
Now here's the crunch. One would have expected a third rise to complete the negative divergence. It didn't happen. The time frame was correct at 24 mins . As soon as the price broke the support line from the H&S, that should have made you hit the sell button. I got out for a measly 2 points. IF you missed that exit, you would only have lost 30 points max from there...... so no big deal.
My data feed /charting was all screwed up for most of the afternoon so I could do nothing. 🙁 Those that got in early should have made close on 100 points.
Iv'e checked that the MA is set to 100 this time. 🙂
Up 215 on the day.
Attachments
Newtron Bomb
Guest Author
- Messages
- 1,602
- Likes
- 87
CM could you explain a pull back target... ive never actually read anything anywhere about this
Thanks
Thanks
It's simple.... treat it just like a bull flag ( or bear flag). The main difference is that it occurs as part of a big push up, where the price needs a breather and the mm's to grab back a few shares so that they can continue to have move shares available as the price moves up. You will only get something like 1 -4 ticks of pullback . In the example here, the pullback is minute, but defined. The target is 8015+ ( 8015-7980) = 8050. As divergence has set in, a scalper would take the 8050 target , or very near.
Note the pullbacks work on the way down too - same rules.
Note the pullbacks work on the way down too - same rules.
Attachments
thanks for the summary cm,
just analysed my trades for yesterday.
I had 2 bad trades - both of them went long on a break thru HOD, both had rsi divergence so my fault, should have seen it.
Went short on the break down of flag at 17.36, but i wasn't clear on my exit - took 2 points at 18.15 - i was nervous - where do you see the exit from that trade?
Went long on the break up of the next flag & closed it when i saw the potential h&s - ready to go short but it bounced.
went short on the way back down thru the neckline.
so all in all i'm quite please that i saw most of the signals you mentioned - even though i only ended up with +15. I should have spotted the rsi divergence on the 2 losing trades .
Newtron Bomb
Guest Author
- Messages
- 1,602
- Likes
- 87
Pullbacks
Thanks CM... think it was just the terminology that you used.
You are essentially treating a pause, or pullback as a mini flag for a continuation of the move.
Thanks again for the clarification :cheesy:
Thanks CM... think it was just the terminology that you used.
You are essentially treating a pause, or pullback as a mini flag for a continuation of the move.
Thanks again for the clarification :cheesy:
Just a quick look tonight.... Just two decent opportunities today.... First the triangle break out around 7pm riding to the top for40 odd points, then the ride down to close for another 50 odd.
The top was really strange, the final clue coming from the break down through the prior triangle target at 8305. Note how the targets were met all the way down....... A bad day for getting whipsawed out.....
The top was really strange, the final clue coming from the break down through the prior triangle target at 8305. Note how the targets were met all the way down....... A bad day for getting whipsawed out.....