Day trading the DOW 31/03/03

ChartMan

Legendary member
Messages
5,580
Likes
47
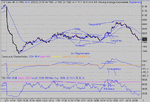
Not a lot to say tonight, and it's a late finish. I'll point out the obvious bull flag that developed across most of the day, and the ensuing target that fell 4 points or so short.
I got so bored with the narrow range I walked away, only to turn round and see a big rise :) To my reckoning , this was a news spike and was followed by the accompanying drop back to par. I don't watch news so I can't say. Still, whatever the reason, the rise was measured and had targets that were met. No sign of a bottom so exit at the close.
 

Attachments

  • dow 31-03-03 1 mina.gif
    dow 31-03-03 1 mina.gif
    21.7 KB · Views: 846
The divergence on cci/rsi worked a treat here though didn't it?

As the ticks were being plotted I was trying to decide if another small bull flag was forming (around 8pm) or if it was going to be a double top.
The cci divergence clinched my decision to go short.

Still couldn't figure out my exit but I considerd ~8091 for a stop based on the target if the bull flag formed in spite of the negative divergence.
Just paper trading.

Best Regards,
Neil
 
Yes, something I've not mentioned - exit points on an " incorrect " trade. Your short with a stop at 8091 was an excellent choice, based on the bull flag target. Maybe a bit thin as targets could be 10 points off either way. Secondly ( I've mentioned this before) when deciding to stop out a wrong trade, base your decision on the chart price, and not whatever price you may see on Fins or D4F. Their bias will automatically take your stop out! Trade your stop manually off the chart. Remember also that a reversal is going to move you out of the 100MA +/- 20 band .
Trading a short of the divergent top is a reasonably safe trade. I have rarely seen a divergent top move into another rally.... We had one not so long ago when the dow went up wildly, giving a divergent top that went on to deliver another 40 points. Good stop loss management would have prevented a large loss. That would have been one of those exceptional trades where the market clearly proved you wrong against an otherwise perfect TA decision. You can't win them all. 95% will do :)
 
Chartman,

Was that bull flag so obvious to everyone??? I didn't see it and would have gone short at 7990 ish - around 19:00.

was there anything else I missed that would have stopped me going short?
 
I agree with you olwenh, the bull flag was only 'obvious' after it had fully formed with that final push down at 14.05. Before that it looked like a descending wedge based above 7990. So going short at 7990 when it broke, I think is quite understandable.

I would be interested in any other clues that would have prevented a short entry at that point.
 
Thanks for your comments, Chartman. I see your point about trading the chart index price rather than the d4f price.

When trading for real, I have always had stop orders in place rather than manually trading them, I just feel safer that way.

Are you saying that when I see my stop go on the sierra chart then I should close out on d4f and take whatever the price is at that moment, including any bias penalty?

I guess it means the stops are safer from bias trips but you pay for it on the bias if they do go.

olwenh - for what it's worth, I didn't see the large bull flag either.

Best Regards,
Neil
 
In my view Chartmans analysis is flawed. I know this viewpoint will be quite controvertial but I will highlight my reasons why!

1) It is easy to draw trendlines and make decisions after the event. i.e. it is post cognitive. The whole picture does change you view.

2) In real time bull flags, patterns etc are not as easily identified.

There is only one way to prove this analysis. That is to post the analysis real time over serveral days. Ultimately that is up to Chartman. So Chartman are you up to the task?

Please bear in mind this is not a dig at Chartman, just a rational analysis from an inbred sceptic.

JonnyT
 
Bull flags form quite often - when you see a sharp extended upwards move you would not expect the price just to keel over and drop like a stone. There is virtually always some form of sideways consolidation before any further major moves. The consolidation often takes the form of a flag or a triangle, and if the price stalls at the top of the 'flagpole' then you would expect one to form.

If there's a big move, just expect the market to pause for breath before continuing. Something I learned from Alan Farley - if you are unsure, stand on the other side of the room and squint at your charts. Looking at them from a distance often puts a totally different perspective on what you are looking at, and it's a lot easier to count Elliott Waves and see flags from a distance.

Sidinuk - even if you thought you saw a descending wedge, these predominantly break upwards and are also good to trade.
 
Does deal4free hunt down/trigger your stops by “stretching” the Bid/Ask bias with “well above the range quotes”?
 
Sorry I meant a descending triangle rather than a descending wedge. They normally break to the downside but are usually continuation patterns rather than reversal patterns.

Identifying the correct patterns in real time is a skill and anyone that can do it acurately has an edge over the rest of us. They are the star TA traders, everyone can spot them easily enough after the event.
 
JT- I take your point, and agree. Post trading analysis is just so easy to apply to charts. That's not the point of my efforts, to show how easy post analysis is. The whole point is to try and educate DOW followers in what to expect and when. Whether they can analyse that in real time as a move evolves is a matter of experience and aplication.
As for doing it blow by blow real time, I did just this for a whole week at the beginning of this series. Judge for yourself if I made a reasoned analysis...... I could do it everyday, but will you pay my wages?
As for identifying the various patterns as they evolve real time, I find that a fairly simple task...... again , take a look at my first weeks dow analysis.
 
This bull flag that people missed- maybe it was because boredom set in.?..... Just a reminder, you need to open out your time scales from time to time- 1 min chart filing your screen, then 5 min then 10 min. This will remind you of the overall picture. If your time scale was too short, there is now way you would see the bull flag. Normally in a good trend they would develop over 10 - 20 minutes. This one took hours.....
 
<i>As for doing it blow by blow real time, I did just this for a whole week at the beginning of this series. Judge for yourself if I made a reasoned analysis...... I could do it everyday, but will you pay my wages?</i>

Judging by the sucess you have been having I don't see why anybody would need to pay you wages...

JonnyT
 
The good thing about Chartman's analysis is that there is no need to get in too early. Looking at yesterday's chart, it was possible to take the long entry, after the bull flag, 10 minutes after the break-out. From experience I have found it is better to enter a trade too late or not at all than to enter too early.

I am sure it takes years of experience to spot these patterns in real-time and trade them well. I am good a seeing them but haven't mastered trading them yet.
 
<i>I'd need the wages because I don't trade for a living.....</i>

Then you should be...

JonnyT
 
Bull/Bear flags

Could you please tell me what you mean by bull or bear flags. I am new to TA but I have read a lot and never come across this, many thanks.
 
Re: Bull/Bear flags

gsethi said:
Could you please tell me what you mean by bull or bear flags. I am new to TA but I have read a lot and never come across this, many thanks.
Go to Picture gallery on the home page and then to patterns then to flags and wedges, a good picture and explan how to calculate targets.
Bill
 
Johnny T,
where ya been man, :rolleyes: Chartman was posting analysis of the Dow real-time last week, cos i was using his analysis to back up my trades. :cheesy: :cheesy: :cheesy:

Oh, by the way, thanks for that Chartman, it has opened my eyes to the 'way of the Dow' :cheesy:
 
I'm a novice but I reckon that was a bull flag between 14:30-16:30 with a target of circa 8130.

Made a few points on the breakout but it ran out of time, market closed before target reached. What does this mean ? Are all bets off or should we expect continuation tomorrow ?

Please feel free to tell me that I am talking a load of ***.

Dino.
 
Top