You are using an out of date browser. It may not display this or other websites correctly.
You should upgrade or use an alternative browser.
You should upgrade or use an alternative browser.
bbmac
Veteren member
- Messages
- 3,584
- Likes
- 789
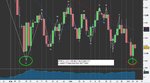
Gbpusd Daily
Another LH confirmed on Gbpusd daily, a new LL to follow on this t/f ?
Below current price:
[ 5336-27 pre 1hr/4hr/Daily swing lo zone -part co-existant with-
[ 5335-5291 prev Weekly swing lo zone with 5293 = Weekly S2 @/around
5188 61.8% 4225-6746 and Monthly S1 @/around
5155 Weekly S3 @/around
5000-4970 weekly ascending trend line area
4819 76.4% 4225-6746
4793 Monthly S2 @/around
G/L
robster970
Guest Author
- Messages
- 4,567
- Likes
- 1,390
bbmac
Veteren member
- Messages
- 3,584
- Likes
- 789
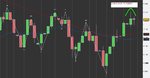
re post #60 above - Uk Ftse 100 cash
Price found support at the bottom of the recent daily t/f range consolidation at the previous daily/weekly swing lo zone confluence with the weekly ascending trend line joining that weekly swinng lo of w/c 7/9/11 with 8/3/09 before it...Nice PB candle there on this daily t/f has seen price rise to the 2nd of the descemding trend lines on this daily t/f, after an upside breech of the first.
So, upside break of this range now or a dip back inside it ?
G/L

robster970
Guest Author
- Messages
- 4,567
- Likes
- 1,390
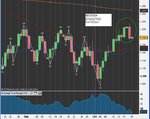
ES or S&P500 cash daily.
Swing high forming? Time to go short again? Plenty of resistance around the 1220 cash level.
Incidentally I am slightly more suspicious about this swing because it has failed to make a lower low than yesterday, indicating that price has ranged inside yesterday's range. This could imply it is consolidating with a view to continuation in it's current direction.
IMO unlikely though - it's rallied for 7 days on nothing.
Attachments
Last edited:
wallstreetwarrior87
Senior member
- Messages
- 2,068
- Likes
- 389
ES or S&P500 cash daily.
Swing high forming? Time to go short again? Plenty of resistance around the 1220 cash level.
Incidentally I am slightly more suspicious about this swing because it has failed to make a lower low than yesterday, indicating that price has ranged inside yesterday's range. This could imply it is consolidating with a view to continuation in it's current direction.
IMO unlikely though - it's rallied for 7 days on nothing.
A bit too early to short in my opinion. To say the market has rallied on "nothing" is not true. In fact has the market even rallied at all? "Rally" is a term branded around on CNBC, Bloomberg and the like because we have had price rising for a few days in a doom and gloom cycle, so their comments come from a hope point of view.
Gold a few months ago was a rally, the current state of affairs can not be compared to gold at this stage.
So the market has still got to rally on "something", hence too early to short.
robster970
Guest Author
- Messages
- 4,567
- Likes
- 1,390
A bit too early to short in my opinion. To say the market has rallied on "nothing" is not true. In fact has the market even rallied at all? "Rally" is a term branded around on CNBC, Bloomberg and the like because we have had price rising for a few days in a doom and gloom cycle, so their comments come from a hope point of view.
Gold a few months ago was a rally, the current state of affairs can not be compared to gold at this stage.
So the market has still got to rally on "something", hence too early to short.
I understand what you are saying by a rally and I'm not trying to be all CNBC about things. It's still moved nearly 150pts (>10%) in the last 7 days on no substantive change in fundamental conditions.
So taking an 18pt risk for a move south that has support 150pts away doesn't feel like a bad set-up as swings go.
robster970
Guest Author
- Messages
- 4,567
- Likes
- 1,390
No swing high today - just as I didn't predict 😆
robster970
Guest Author
- Messages
- 4,567
- Likes
- 1,390
I'm not really a one for Candlestick patterns but every now and again I pay attention to some of them.
Bearish engulfing on the S&P500 Cash or ES daily charts?
The little one is Sunday nights 11pm to midnight candle which I haven't filtered out.
Also a note on this trade. The daily broke new highs but failed to close above, which means tomorrow is even more likely to be a down day. I've gone down to the hourly timeframe to get an entry. I'm a seller at 1220. Not sure i'll get it though. Only good till the end of the day.
Last edited:
wackypete2
Legendary member
- Messages
- 10,211
- Likes
- 2,058
Nice formation on the USDCAD H1 chart. I'm looking for a false break out downward to test today's low at 1.0205 (yellow line). I'll buy around there with a 25 pip stop. The flag is about 50 pips fom high to low so exit would be 50 pips from the high at around 1.0315
Peter
Peter
Attachments
LuKOs.ro
Member
- Messages
- 52
- Likes
- 2
Also a note on this trade. The daily broke new highs but failed to close above, which means tomorrow is even more likely to be a down day. I've gone down to the hourly timeframe to get an entry. I'm a seller at 1220. Not sure i'll get it though. Only good till the end of the day.
Buckle up for the downswing in S&P 😀. I reckon it will reach $1150 by the end of the week based on recent volatility.
robster970
Guest Author
- Messages
- 4,567
- Likes
- 1,390
Buckle up for the downswing in S&P 😀. I reckon it will reach $1150 by the end of the week based on recent volatility.
I wonder what Brettus will do if it doesn't hit 1220 today but clearly demonstrates the forming of a swing high.
e2a - sat here at 7.30pm, watching cash index approaching 1218 lol
Last edited:
wallstreetwarrior87
Senior member
- Messages
- 2,068
- Likes
- 389
Also a note on this trade. The daily broke new highs but failed to close above, which means tomorrow is even more likely to be a down day. I've gone down to the hourly timeframe to get an entry. I'm a seller at 1220. Not sure i'll get it though. Only good till the end of the day.
Just out of interest; why would tomorrow be even more likely to be a down day just because it failed to close above?
VendorExterminator
Member
- Messages
- 73
- Likes
- 10
Buckle up for the downswing in S&P 😀. I reckon it will reach $1150 by the end of the week based on recent volatility.
You're with the consensus view there, and we know what happens to the herd in the markets...
robster970
Guest Author
- Messages
- 4,567
- Likes
- 1,390
Just out of interest; why would tomorrow be even more likely to be a down day just because it failed to close above?
Out of curiosity, would you consider going short yet or do you think it's got more to go?
wallstreetwarrior87
Senior member
- Messages
- 2,068
- Likes
- 389
Out of curiosity, would you consider going short yet or do you think it's got more to go?
More to go!!!!!!
Remember we need to rally on "something". That something is just around the corner.
Then you may have your short position (3 weeks, possibly 4 should do the trick)👍
robster970
Guest Author
- Messages
- 4,567
- Likes
- 1,390
More to go!!!!!!
Remember we need to rally on "something". That something is just around the corner.
Then you may have your short position (3 weeks, possibly 4 should do the trick)👍
LOL - for these swings, I just take the set-up when they occur (it's not occurred for me yet) so I was curious to see where you were.
Is the something you are referring to the G20 Franco/German answer to European financial problems :idea:
wallstreetwarrior87
Senior member
- Messages
- 2,068
- Likes
- 389
LOL - for these swings, I just take the set-up when they occur (it's not occurred for me yet) so I was curious to see where you were.
Is the something you are referring to the G20 Franco/German answer to European financial problems :idea:
Well it is certainly an event to get traders/longer term investors juice's going!
I know you only trade your set ups, and thats how it should be, trade your own plan.
Im sure there will be ample opportunities before these events play out.