You are using an out of date browser. It may not display this or other websites correctly.
You should upgrade or use an alternative browser.
You should upgrade or use an alternative browser.

trader_dante
Veteren member
- Messages
- 4,535
- Likes
- 1,704
bbmac
Veteren member
- Messages
- 3,584
- Likes
- 789
Yeh, and there were earlier entries to the 1hr PB close based on the 1 3 5 and 15min repeating regular bearish div reversal set-ups, the 5min regular bearish div one is shown below and nice bearish engulf thrust trigger on that.
There was a 3 fib cluster 5362-73 confluence just at bottom of that previous support (previous Daily/4hr swing lo zone) and I know you had posted elsewhere earlier about potential offers @/around 5366 as I had here.
Nice one.

There was a 3 fib cluster 5362-73 confluence just at bottom of that previous support (previous Daily/4hr swing lo zone) and I know you had posted elsewhere earlier about potential offers @/around 5366 as I had here.
Nice one.
Bbmac,
Did you get the short off 1.5366? There was a great level there and it's been the exact high of day so far. It was a beauty to take us into that longer term move down.
I'm loving Cable at the moment.
Last edited:

N Rothschild
Legendary member
- Messages
- 5,296
- Likes
- 603
i love how you have stuck to the same method and instrument all these years, must really work for you
scose-no-doubt
Veteren member
- Messages
- 4,630
- Likes
- 954
i love how you have stuck to the same method and instrument all these years, must really work for you
Wish it would f*cking work for me.
N Rothschild
Legendary member
- Messages
- 5,296
- Likes
- 603
nothing will work for you, sorry
bbmac
Veteren member
- Messages
- 3,584
- Likes
- 789
Either that or I'm 'flogging a dead horse' Lol...Seriously though I see no reason to ' get off a winning horse..' If you've got an edge and it works for you -stick with it and try and improve it where you can -based on empirical evidence and lots of it.
G/L
G/L
i love how you have stuck to the same method and instrument all these years, must really work for you


bbmac
Veteren member
- Messages
- 3,584
- Likes
- 789
Immediately downside of current price:
5363-5351 prevminor 4hr/1hr sw hi zone incl 5359 = 38.2% 5278-5408
[ 5347-43 prev minor 1hr sw hi zone incl 5343=50% 5278-5408
[ 5345-40 ascending 1hr t/f trend line on this current 1hr candle
5328-26 prev 1hr sw loi zone incl 5328 = Dly Pivot and 5327 = 61.8% 5278-5408
5320-10 prev 1hr sw lo zone
5309 76.4% 5278-5408
5300-5289-78- 5270 prev Weekly/Daily/4hr/1hr sw lo zone incl 5297 = 85.4% 5278-5408 and 5288 = Daily S1 @/around
5239 Daily S2 @/around
5199 Daily S3 @/around
5196 Weekly S2 @/around
5189 61.8% 4225-6746
[ 5150-30 ascending Monthly/Weekly t/f trend line on this daily candle
[ 5148 Monthly S2 @/around
5034-4945 prev weekly sw lo zone incl 5017 Weekly R3 @/around
G/L
trader_dante
Veteren member
- Messages
- 4,535
- Likes
- 1,704
Nice analysis.
I've been long Bund and Short Crude today. Haven't looked much at Cable.
I've been long Bund and Short Crude today. Haven't looked much at Cable.
bbmac
Veteren member
- Messages
- 3,584
- Likes
- 789
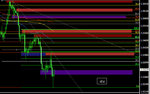
Congratulations to all those that sold and held the LH on 4hr at 5408, - the previous minor dly/4hr swing lo, 2 x fibs, @/about descending 4hr t/line and then 100sma on 1hr....5270 the previous swing lo on weekly/daily was breeched in the move with a current and likely Friday lo of 5234 = a 50% extension of previous day's range/ @/around Daily S2.
Strong bounce up at 5234 resulting in a perfect 4hr PB candle which succeeded the imperfect 1hr PB...with price @ 145% of the 20 day atr, and it may seem like more but only 84% of ther 20 week atr at the 5234Lo.
4hr is below.
G/L
Strong bounce up at 5234 resulting in a perfect 4hr PB candle which succeeded the imperfect 1hr PB...with price @ 145% of the 20 day atr, and it may seem like more but only 84% of ther 20 week atr at the 5234Lo.
4hr is below.
G/L
Attachments
Last edited:
bbmac
Veteren member
- Messages
- 3,584
- Likes
- 789
From a technical persepective looking at the weekly chart...a break lower this week saw a LL just below the last significant LL of 5270 on this t/f but price closed bullishly on the 4hr and below on Friday having bounced off the 5234 weekly Lo. This Weekly t/f is showing some bearish signs therefore but probably still looks a little mixed at the moment, admittedly though more bearish leaning than bullish ?
G/L

G/L
Last edited:
bbmac
Veteren member
- Messages
- 3,584
- Likes
- 789
Looking at the Daily, some evidence of buyers in the vicinity at the lows re Thursday and Friday's daily cndle closes and this is reflected on the 4hr/1hr t/f's...it's messy on this t/f re fractal swings but a general (overall price action-peak/valley analysis) downtrend is in evidence.

bbmac
Veteren member
- Messages
- 3,584
- Likes
- 789
Below Friday's closing price I see the following potential rbs/support factors. Please be aware that is not to say that I think all of them have a high probability of see-ing demand coming in at those levels (howsoever permanently or temporarily) - just that in respect of what my own methodology deems 'main' potential support factors and 'minor' factors (calculated pivots) - this is what is present below Friday's closing price.
The general principle underlying my trading edge is to look for repeating patterns of confluence and this applies to potential supp/res factors. IWhen you examine potential supp/res factors for any length of time you will notice that certain combinations offer generally stronger supp/res then others.
5305-5299 prev minor 1hr sw hi zone
5283-77 prev 1hr sw lo zone
5260-34 prev 4hr/1hr sw lo zone (Friday and last week's Lo)
5228 Monday's Daily S1 @/around
5198 Weekly S1 @/around
5189 61.8% 4225-6746
[ 5150-20 ascending Monthly/Weekly t/f trend line on this daily candle
[ 5148 Monthly S2 @/around
[ 5144 Monday's Daily S2
5083 Weekly S2 @/around
5034-4945 prev weekly sw lo zone incl 5017 Weekly R3 @/around and 4970 = Monday's Daily S3 @/around
4935 Monthly S3 @/around
4819/17 76.4% 4225-6746 / Weekly S3 @/around
4796 Monday's Daily S4
4593 85.4% 4225-6746
4551 Weekly S4 @/around
G/L
Last edited:
bbmac
Veteren member
- Messages
- 3,584
- Likes
- 789
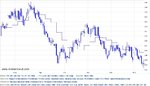
repeating patterns of bullish divergence to the daily chart at Fri/last week's 5234 Lo ..How significant these turn out to be we will know soon enough..I wouldn't be surprised to see more uposide rally on Moinday ?
1hr shown below as the example.

G/L
1hr shown below as the example.
G/L
barjon
Legendary member
- Messages
- 10,752
- Likes
- 1,863
From a technical persepective looking at the weekly chart...a break lower this week saw a LL just below the last significant LL of 5270 on this t/f but price closed bullishly on the 4hr and below on Friday having bounced off the 5234 weekly Lo. This Weekly t/f is showing some bearish signs therefore but probably still looks a little mixed at the moment, admittedly though more bearish leaning than bullish ?
G/L
http://www.trade2win.com/boards/gen...-understated-problem-gbp-usd.html#post1766626
bbmac
Veteren member
- Messages
- 3,584
- Likes
- 789
New gbpusd thread for 2012 here - see if anyone wants to contribute.
http://www.trade2win.com/boards/forex-discussion/142890-gbpusd-analysis-2012-a.html#post1767396
http://www.trade2win.com/boards/forex-discussion/142890-gbpusd-analysis-2012-a.html#post1767396
Similar threads
- Replies
- 11
- Views
- 9K