BBmac's Gbpusd thread

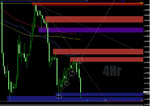
Cable has given back 50% of the 6409-6077 fall having found support at the prev daily swing hi=prev res=potential rbs zone discussed and shown in post above..1hr is in an uptrend now but has found supply at the 100sma on the 1hr chart, ( similarly the 6409 Hi was the 100sma on the daily chart.) and this is back in the previous 4hr congestion channel.

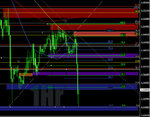
The current 1hr chart in respect of potential near-term obvious supp/res factors is below: Not shown on this chart are the unbreeched fibs of the 6876 and 6720 - 6077 swings with 23.6% of the larger 6876-6077 swing nearest, above current price @ 6264. The fibs shown relate to the 6409-6077 swing.

G/L

2qbce2d.jpg
 
W/e 18th Dec 09

With a bearish candle close again on the Weekly t/f it remains in an obvious range between 7044-5707 but price is on a downward trajectory having breeched and a candle close below it's steepest ascending trend line.
29yl81y.jpg


Turning to the Daily t/f and with 3 x LH and 3 x LL it is in a downtrend having seen a downside breech of the 61.8% of the recent 5707-6876 swing up, and the previous swing hi=previous resistance=potential rbs zone at which price found some support on first test (visible on 1hr/4hr t/f) although price closed back above the later. A bearish candle close on Friday candle, this t/f is descending in a channel.

35nd7pc.jpg


Turning to the 4hr, and following a false upside breech of the recent congestion on that t/f price sold down to Friday's Low see-ing this t/f developing a downtrend following a L, LH retest of the congestion channel following 1st downside breech, and LL now. Like the 1hr t/f it's 100sma is below it's 200sma and these are pointing down.
1z3nsxx.jpg


G/L for next week.
 
Potential support below Friday's low

The 200sma on the Daily and the 76.4% fib of the recent major 5707-6876 swing up are coming in @ around 5998/5978 respectively and below here the previous swing low=previous support=potentuial support zone visible on the Daily and Weekly screenshots in the post above this one...this runs 5780-5707.

This is not to say that there will be other areas that may offer support if tested, not mentioned above, just that these are the main potential support factors I can identify below Friday's low.

G/L
 
resistance @ descending trend line - 1hr

The trend line joins the highs of Wednesday and Friday last, as Friday's hi found resistance off the previous ascending trend line on same t/f (wide dotted grey line.) Current downward trajectory off the trend line-1st test as 5min prints a H, HL then LH,L,LH and LL off that trend line bounce.

G/L

2cglyrc.jpg
 
5min downtrend

The current 5min is shown below..downtrend exstablished there but only on this t/f so far with 30min see-ing a H,HL,LH,HL,then H,L,LH, and LL now off and including the Friday Hi, so may be exstablishing a downtrend...time will tell..61.8% fib of Friday's 6050-6166 recovery has now breen breeched with this sell-off

ilgg9x.jpg


G/L
 
Mni

The Mni cable analysts/desk must be on early hols, distinct lack of bid/offer info so far this London session...rev0very off 6088 and a great 1min trigger t/f regular bullish div reversal set-up with supporting 5min osc extremes/cci reversal set-up there (1min shown below) but no potential support/rbs pre-identified so fad to stay flat...shame!!..would have gone for it even just with mni touting bids there.

5min hidden divergence building now but no convincing 30min/1hr downtrend to re-enter after the deeper pullback...1hr candle shaping up as a pinbar/hammer....3mins to it's close...anything can happen of course...

G/L

vytyio.jpg
 
5min's gone a bit Pete Tong

5min Downtrend halted at 6088 then an uptrend started and now a L below last HL of that developing uptrend...all a bit messy with 30min trend t/f not exactly clear either.

Uk/U.s Q3 Gdp finals later this week

10z4bjs.jpg


1hr may be forming an ascending channel?

2dljehi.jpg


G/L
 
Last post of this year

Cable continues it's decline aided by a disappointing Q3 GDP revision to -0.2% from -0.3%, market was expecting 0 or -0.1%. 1hr and 4hr in a downtrend, the screenshot below showing the previous ascending support trend lines , the undersides of which (sbr) where resistance was found for further legs down, today's current intraday hi being the lowest of those...price challenging the 200sma on daily t/f right now, with mni talking of '...decent demand @ 5995...' Weekly S1 & Daily S1 pivots in area too....and the 76.4% fib of the 5707-6876 swing up is not far behind.

Below here and attention will turn to the previous Daily/Weekly Swing lo=prev supp=potential support zone 5780-5707 area as next most obvious potential support factor, with that 38.2% fib of the current yearly hi - lo there 3505-7044, @ 5707 area.

op5oi8.jpg


This is my last post of this 2009. Thanks to all those who have contributed to and followed this thread during 2009..Wishing you a Happy Xmas and Prosperous New Year.
 
Hello bbmac,

Thank you for your efforts on this forum.... they are very much appreciated.

Any chance I could bother you for some description on your exit timing and target setting?
 
Hey BBMAC,

What happened to this thread? Always enjoyed your analysis on Cable...

My analysis for Cable today and a few ideas depending on your style ;

Operation Assault GBP/USD

Operation Assault $GBPUSD : Phase #1 : Isolate the objective
Chart.ly - Trader_Dante: Operation Assault $GBPUSD : Phase #1 : Isolate the objective

Operation Assault $GBPUSD : Phase #2 : Reconnaissance
Chart.ly - Trader_Dante: Operation Assault $GBPUSD : Phase #2 : Reconnaissance

Operation Assault $GBPUSD : Phase #3 - The Plan.

Strategy #1 Consolidation and Reorganisation
Chart.ly - Trader_Dante: Operation Assault $GBPUSD : Phase #3 - The Plan. Strategy #1 Consolidation and Reor...

Strategy #2 The brute force attack
Chart.ly - Trader_Dante: Operation Assault $GBPUSD : Phase #3 - The Plan. Strategy #2 The brute force attack

Strategy #3 The Ambush
Chart.ly - Trader_Dante: Operation Assault $GBPUSD : Phase #3 - The Plan. Strategy #3 The Ambush

Strategy #4 The Counter Attack
Chart.ly - Trader_Dante: Operation Assault $GBPUSD : Phase #3 - The Plan. Strategy #4 The Counter Attack
 
Hi Td, ....If I post anything I tend to post any meaningful analysis over at ff.com now.

Currently today's precipitous price fall testing last week's lo, @/around the ascending Daily trend line which is in and part of the previous Daily/4hr/1hr swing lo zone leading down to 5361 where it is currently encountering some demand.

Immediately @/ below here:

[ 5390-74-68-61 prev Dly/4hr/1hr sw lo zone
[ 5380-70 ascending Daily t/f trend line on this daily candle
5347 Monthly S1 @/around
5334-5314- 5270 prev Weekly/Daily/4hr sw lo zone incl 5311 Weekly S1 @/around (* 5420-5270 co-existing prev weekly sw lo zone)
5196 Weekly S2 @/around
5189 61.8% 4225-6746
5148 Monthly S2 @/around
5145-30 ascending Monthly/Weekly t/f's trend line on this weekly candle


The 4hr chart below shows the test and bounce from the underside of the breeched 1hr ascending trend line (wide dotted line.)

G/L
 

Attachments

  • z.jpg
    z.jpg
    102.1 KB · Views: 185
Last edited:
Hi Td, ....If I post anything I tend to post any meaningful analysis over at ff.com now.

You and me both. Haha! I've got a big thread on the go over there...

Just one more update on Cable : Short term traders should look to take profits around here at 1.5371 ahead of the major D1 lows.

That should give you nicely over a point profit (approx 110 depending on where you got in)
 
1 and 3min repeating regular bullish div plays at the current daily lo...can't help thinking that the downside remains vullnerable overall though.

G/L

17r8rs.jpg
 
Immediate upside obstacles shown on near-term current 1hr chart below.

G/L
 

Attachments

  • z1.jpg
    z1.jpg
    93.5 KB · Views: 194
1 and 3min repeating regular bullish div plays at the current daily lo...can't help thinking that the downside remains vullnerable overall though.

G/L

17r8rs.jpg

I know it makes no difference to you with your lower TF work, bbmac, but as far as I am concerned, Sterling will gravitate towards the order flow beneath the weekly level and at the moment I am mainly short positioning unless price action shows me otherwise.
 
I tend to agree with your overall technical short side biais and yeh there are opportunities to go against that on the lower t/f's...By the weekly level you mean the previous Weekly/Daily swing lo down to 5270 (last year's lo) ?

Gotta stay vigilent in this market re any sudden changes in sentiment though with all the fundie stuff in play.

Ascending Daily t/f trend line has now been breeched to the downside as has that previous Daily/4hr/1hr swing lo down to 5360, price trading down to/about Monthly S1 pivot at current daily lo. 123% of 20day atr so far today re pip move.

Current near-term Weekly chart below;

Thanks,

G/L

2yjog1z.jpg


I know it makes no difference to you with your lower TF work, bbmac, but as far as I am concerned, Sterling will gravitate towards the order flow beneath the weekly level and at the moment I am mainly short positioning unless price action shows me otherwise.
 
Yesterday's bearish thrust b/o candle saw some downside follow thru off the asian hi to a new lo deep in the previous weekly/daily swing loi zone extending to 5270...there the 1min regular div signalled the start of a pullback/extended pullback (or more ?) This was supported by repeating reversal set-ups to 1hr, the reg div 1hr shown below....

Above here and I would imagine the previouys daily/4hr swing lo 5360-5406 that contains the previous now breeched daily ascending trend line may see some offers ?

@/below the current lo

5315- 5270 prev Weekly/Daily sw lo zone
5261 Daily S1 @/around
5196 Weekly S2 @/around/Daily S2 @/around
5189 61.8% 4225-6746
[ 5148 Monthly S2 @/around
[ 5155-40 ascending Monthly/Weekly t/f trend line on this daily candle
5082 Daily S3 @/around
5034-4945 prev weekly sw lo zone incl 5017 Weekly R3 @/around
4935 Monthly S3 @/around

G/L

2v7ym88.jpg


k51ij9.jpg


2vvjpeh.jpg
 
Top