bbmac
Veteren member
- Messages
- 3,584
- Likes
- 789
There follows a brief discussion on my methodology for identifying potential support/resistance in any prevailing market, ...any addition to / discussion of is always useful;
Identifying potential Support /Resistance /SBR / RBS
[SBR: Support Becomes Resistance. RBS: Resistance Becomes Support ]
In identifying areas at which there may exist potential for Support or Resistance sufficient for price to reverse it's immediate direction, there are three (2) main factors I look for:
1. Previous price swing Hi or Lo areas
2. Fib Retrace areas.
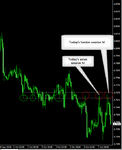
Useful too (and could probably be considered as 3. in respect of the above) are the updates given by imarket information vendors detailing areas at which bids/offers may lie in the prevailing market and the potential strength/depth of those orders.
The Daily Pivots (Daily S3 through Daily Pivot to Daily R3) can be useful too as part of any confluence of potential Support or Resistance.
These sites will confirm where the pivots are located, the first of which having a facility to alter the time at which they are calculated;
[url=http://www.actionforex.com/forex_analysis_and_forecasts/pivot_points/]
Of course custom indicators will plot them on your charts if required.
Weekly and Monthly Pivots, as well as Mid Pivots (on any time frame) if used, should in my experience all be treated as secondary factors in any consideration of potential Support/Resistance.
The principle question in pre-identifying potential areas of Support/Resistance is whether there will be sufficient market participants/volume of orders to produce a price swing at that area. Whilst there are many other ways of identifying potential Support/Resistance, I limit my analysis in the main to the factors that may indicate this that are historically proven to be used by the market in such quantities so as to achieve this result.
In identifying the above, I seek out the areas at which as many technical factors exist as possible (the clusters) thus suggesting that Support or Resistance is likely to impede the most immediate price action In this way there is the greatest chance that price will react favourably should a set-up be identified at these areas. A set-up at such an area provides you with high probability technical confluence so as to warrant a market entry.
Dealing with points 1. and 2. in more detail;
1. Previous price swing Hi or Lo areas
Identifying previous price swing Hi or Lo areas on the time frame above my intermediate chart time frame can assist in pinpointing areas that may offer Support or Resistance should they be re-tested. I.e.
a. A previous swing Hi area should be viewed as potential Resistance if being re-tested from the underside and as potential RBS if being re-tested from the upside, following a pullback in an uptrend.
b. A previous swing Lo area should be viewed as potential Support if being re-tested from the upside and as potential SBR if being re-tested from the underside, following a pullback in a downtrend.
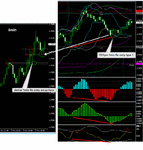
In identifying previous price swing Hi and Lo's, I do so primarily on the 1hr chart (close enough to my 30min ‘trend’ time frame and commonly used as the trigger by position trend traders.) On an intraday basis if on the smaller time frames - as a trend develops it may be necessary to identify such previous price swing Hi/Lo's on your intermediate chart too (for me the 5min) that may act as RBS/SBR for the purposes of acting upon a Re-entry set-up on the 1min trigger or any confirming 5min Re-entry set-up that supports a 1min Reversal set-up, following any deeper pullback/retrace in the trend.
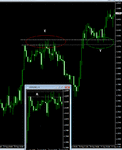
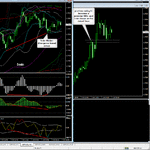
In the screenshot you can see that the previous swing Hi 's at point X provided both Resistance when re-tested from the underside, as well as Support (RBS) at point Y, when tested from the upside. Indeed when providing support at point Y there were 2 tests of the support before a move higher.
The area shown as A in the small chart, is the effective potential Support zone (RBS) at the previous swing Hi shown as point X in the main chart. I.e. The potential Resistance or RBS zone of any previous swing Hi area like point X consists of the point between the highest candle shadow/spike to the highest price close of the candles that form that overall previous swing Hi area. These are marked by the dotted white lines. Conversely in the case of a previous swing Lo area the potential Support or SBR zone would be the area between the lowest candle shadow/spike to the lowest price close of the candles that form the overall previous swing Lo area.
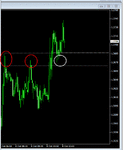
As mentioned above, these zones hold true as potential resistance should a previous swing Hi area be tested again from the underside, (i.e. double /triple tops.)You can see this at the swing Hi area at point X above as there were 4 tests on this potential Resistance from the underside, before it broke to the upside. Similarly previous swing Lo areas can be viewed as potential Support if tested again from the topside (i.e. double/triple bottoms)
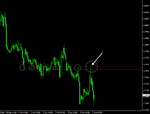
Where an area that cannot be identified by means of 1. or 2. above results in support/resistance; if that area is re-tested and a set-up then presents itself this can be considered as the 2nd (+) test of the area that has previously proven to act as support/resistance.
(Generally speaking the more times an area of support/resistance is tested the stronger it becomes. Until tested all areas are 'potential' areas until proven.)
2. Fib Retrace areas.
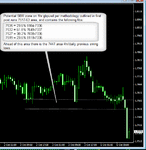
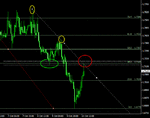
Fibs are drawn on all the major swings of the current prevailing moves that exist in the market, including the intraday move. These Fib retraces can act as Support/Resistance. Where these Fib retraces co-exist with the other factors that indicate potential Support or Resistance (1 & 3 above,) so much the better.
3. Market depth information
These updates come via certain broker news feeds or by subscription to the info-provider/vendor direct. Equity and other exchange traded instruments have the advantage of more transparent market depth.
Note:
i. The discussion above assumes a triple time frame approach, ie the intermediate time frame, the lower trigger time frame, and the higher trend time frame.
ii. A 'set-up' can mean whatever an individual trader deems it to be mean, and it will be part of their 'market edge' It could be pure price action and/or indicator based.

