bbmac
Veteren member
- Messages
- 3,584
- Likes
- 789
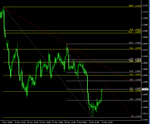
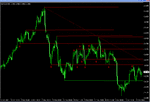
I'll start the Weekly thread off with a look at the 4hr GBPUSD chart ahead of Monday's action....hope this might become a more active thread with multi-pairing contributions.
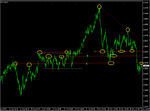
Area A the 0345/55 has acted as both resistance in September and Support in November and is currently acting as resistance again.
Area B is a minor swing hi/low that could now act as resistance in any test from the underside (0450/60) area. As it did the
Area C acted as both resistance then support x 5 and could well act as resistance again any test from the underside…0516-30.
These are main areas to be aware of, and the descending resistance trend line is the nearest potential trend line resistance that is currently as yet untested joining just 2 peaks.
There is also a congestion zone 0242-0496 (white dotted lines) that acted as support on a retest down from the 2.1162 Yrly High, the support finding a lower high at 0832 area and a subsequent breech down to last week's 0174 lows.
Attachments
Last edited:

