Hi devilbis
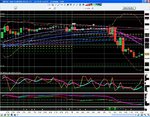
I find that certain patterns of oscillator divergence and indeed oscillator extremes can pinpoint swing points, be them minor or major. Of course on a trending day oscillators will diverge as momentum decreases and this can be useful at identifiable support/resistance. In terms of trend hidden/reverse divergence used in conjunction with the phenomenon of supp becomes res and res becomes supp can be useful too.
The link is a description of the types of divergence patterns I look for:
http://www.trade2win.com/boards/showthread.php?p=362564#post362564
These with channel/band deviation form the technical patterns (set-ups) that i look for at identifibale areas of potential support/resistance/sbr/rbs, so for me I find them extremely useful. Divergence is the only way i know to turn a lagging indicator into a potentially leading indicator.