Essential elements in tech analysis discussion

bbmac

Veteren member
Messages
3,584
Likes
789
Probably the most important phenomenons in technical analysis are support/resistance, price action and trend. Once you have mastered these 3 elements it becomes easier to understand where the highest probability entry points are to any liquid market, giving the best chance of a succeful trade.

I will deal here first with Support/Resistance.

Undoubtedly the most important element for any swing trader, support in a market resides at areas where the market has previously thought an instrumnet to be undervalued and where other technical factors may lie that could good rise to bids at that area, based on repeating patterns of behaviour in the market. Conversly, resistance lies at areas where the market has previously thought an instrumnet to be overvalued and where other technical factors may lie that could good rise to offers at that area, again based on repeating patterns of behaviour in the market. It's as simple as that, but how do you accurately identify potential areas of support/resistance?

Any given traded instrument is made up of a disparate market of buyers and sellers. Add to this that buyers may become sellers and sellers may become buyers at any time, and you have what on the surface appears to be a recipe for a chaotic market. Support/Resistance is one of those phenomenons that Dr Alex Elder refers to as 'Islands of order' and constitute areas where it becomes more predictable to guauge future market behaviour.

With such a disparate mix of market participants it is perhaps not surprising that there are many measures of support/resistance in use, and they are briefly summarised as under;

a. Previous market swing points Hi's / Lo's (principly on the longer time frames.)
b. Standard/Floor pivots S1 S2, R 1 R2 for eg.
c. Other pivot calculations, Camarilla, Demark, Woodies, Fib pivots, murraymath etc...
d. Fibonacci retracements and extensions.
e. Trendlines (principly on the longer time frames.)
f. Range extremes
g. Indicator readings ...for eg, top/bottom of bollingers/channels, Moving averages etc.


In understanding support/resistance the principle goal is to highlight areas at which the market may turn, and it follows therefore that the more measures of support/resistance at a certain level, there exists a greater probability than not that sufficient numbers of market participants will act at that level to produce a reaction.

The previous swing points in the market tell us where support/resistance once resided and may do again and the rest of the list tells us where the highest probability areas are in conjunction with the previous swings, in the future market.

I trade the forex market major pairings, and if I had to pick out the most important measures of support/resistance in those markets, I would say they were Previous swing Hi's and Lo's, Trend Lines and Fib retracements and extensions. Others may disagree.

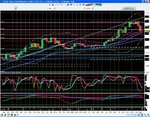
The attached screenshot shows the daily Resistance trend line on Gbpusd that was hit today at 0474 resulting in an intraday 80pip correction from those highs today...just one example of a trend line being important. 0470-74 was also the area of the pivot Daily R1, as well as being the Weekly H3 camarilla pivot and the high of 17/7....an ewxample where a 'confluence' of potential technical resistance measures came together to produce a reaction, at what amounted to a resistance 'cluster.'

I will discuss more about price action and trend in subsequent posts, and indeed supp/res.
 

Attachments

  • daily.gif
    daily.gif
    27 KB · Views: 510
Last edited:
  • Like
Reactions: TWI
One thing I would always advise having a good appreciation of is divergence
 
Hi TWI, I absolutely concur with your comment about divergence, and in fact my own technical trading system/methodology is based around oscillator extremes/divergence with band/channel deviation at areas of support/resistance.

Divergence of course refers to the divergence between price and oscillators. Oscillators essentially measure momentum and like most tech indicators are calculated on past price, so lag current price action. An effective way to turn a lagging indicator into a potential leading indicator is it's divergence from price. Indeed Dr. Alex Elder for one, states that the strongest signal in tech analysis is macd divergence from price.

Be that true or not, oscillator extremes/divergence are a useful technical tool and are particularly useful in highlighting whether a potential supp/res area will more probably than not produce a reaction. One thing is for sure though, and that is that recognising divergence in the oscillators will be far more useful a tool if you can identify potential support/resistance and trend accurately.

I was interested to listen in to Wayne McDonnel of fxbootcamp during one of his regular free webinars via fxstreet.com speaking about his use of indicators. He stated that he uses a momentum oscillator to measure momentum of price, bollingers to measure volatility of price, price action and ma's to measure trend and stochastics to measure speed of price.
 
re supp/res, eg.

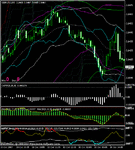
The attached 2 screen shots show the price action today (Weds) The drop down from the Daily trendline mentioned above found support at 0395 before another attempt at a run up, before finding resistance in the area around the friday Highs (A) selling down from there again (B,) price currently around 0407 as I write this.

The second 5min screenshot shows the intraday technical set-up. Hidden/reverse divergence with band deviation. 0441 was Fridays high and the area 0442-0446 were the highs from earlier last week, the 3/10 and 2/10.
 

Attachments

  • 1hr.gif
    1hr.gif
    15.8 KB · Views: 485
  • 5min.gif
    5min.gif
    18.4 KB · Views: 484
From Brett Steenbarger;

When I visit different proprietary trading firms, investment banks, and hedge funds, I feel a bit like Alice in Wonderland. The reality I experience at these firms is nothing like the one that is portrayed in the popular trading literature.

Trendlines? Oscillators? Chart patterns? Wave formations? Angles? All of those figure prominently in the books, seminars, and magazine articles that dominate the mass market.

Yet I have yet to see a successful trader at any of these firms use these tools. You would think, by sheer chance, having worked with well over 100 traders personally and closely, I'd find *someone* who trades the way the books and magazines describe.

But no. I have found none.

Rather, what I find is a kind of reasoning that might best be called "relational". The traders who are doing this for a living and making a successful living year after year invariably relate the instrument(s) they are trading to a broader network of market events.

This can take the form of intermarket analysis (i.e., developing a view on currencies based on interest rate differentials and yield curve dynamics across countries), but can take other forms as well. For instance, I notice short-term S&P traders at prop firms looking at what is happening in related markets (NQ, for example) and sectors (financial stocks) to get a handle on what their market is up to.

Somewhat defensively, a few readers have replied that it *is* possible to make money trading simple market patterns. To clarify (and also to apologize if I was unclear): I never meant to say that it is *impossible* to succeed without relational reasoning. Rather, I was passing along my observations over the last two years that I have not encountered a consistently successful professional trader who trades simple, linear relationships limited to their trading market.

It was not always thus. When I first came to Chicago, I saw many traders thrive simply by trading patterns in the depth-of-market displays for their instruments. As an increasing proportion of that trade became automated (and the automation exploited mispricings across instruments), that trade went away. It is now rare to see a highly successful short-term trader in Chicago trade in that market-making style.

Similarly, in the late 1990s, it was common to see traders thrive by trading momentum patterns among NASDAQ stocks. That trade also dried up as we moved to record low volatility. It doesn't mean that someone, somewhere *can't* make a living by trading short-term momentum, but the opportunity is not what it once was.

There is much to be said for trading a style that is congenial with your talents, skills, and interests. Still, such a style must be consistent with objective opportunity if it is to yield enduring success. Many of the trading approaches described by the popular trading literature (such as buying strength and selling weakness) not only have no edge in short-term trading of stock indexes, but actually run counter to objective opportunity.

I'll state my position baldly and take the heat as it comes: I think the individual, independent trader is being sold a bill of goods. There are firms that have a vested interest in making traders believe that success is easy and that the simple patterns offered by their software, trading courses, and publications will provide a road to riches.

It's no different from the "no-money down" real estate seminars or the pyramid marketing schemes. All promise great returns with little effort or knowledge.

The irony is that traders would love for me to validate their fantasies and tell them that untold wealth is around the corner if they just follow a particular set of indicators or self-help methods.

But I can't do that. I visit the traders who are truly successful--and whose success I can personally verify--and I see them doing something very different from what the seminars and magazines describe. Similarly, when I look at who is truly successful in real estate and in business, I find entrepreneurs who study and master their markets--not people who are acting upon a seminar, a wing, and a prayer.

The empirical evidence suggests otherwise?

jog on
d998
 
Hi, yeh, I've read quite a bit from Brett Steenbarger, Mark Douglas, Avi Frischer etc...

As for that extract, I'm not sure it represents emprirical evidence. There is no doubt that the masive growth in the use of pc's and software has seen a huge growth in tech analysis as an alternative/complimentary tool to fundamental analysis over the last 20years.

There is certainly a case to be argued that any anlysis is self fulfilling, and certainly tech analysis is to some extent. Ie It works beacuse sufficient market participants use the same tools and respond to an overbought oscillator or a fib level for eg.

Whatever the case, the only people I ever see that dismiss tech analysis generally fall into 2 categories, i) Those that have never used it, and ii) those that have and failed to make it work for them. Personally I have absolute emprirical evidence that it does work as I'm sure do many others, but it is just a tool in making rational trading decisions based around recognising repeatable patterns that on the balance of historical probabilities will result in a certain price movement.
 
I'm very pleased that there are doubters of simple repeatable patterns. :cheesy:

Here's an example of bearish regular divergence on EUR/US$ yesterday around 2pm and today around 11am. I use SMI's at different settings (i.e different timeframes).

Isn't it amazing that when price tests a pivot and/or resistance line (higher timeframes) and/or upper BB and/or trendline, you get a good probability of a reversal!
 

Attachments

  • EURUSD 30 min BearRD 111007.JPG
    EURUSD 30 min BearRD 111007.JPG
    299.3 KB · Views: 526
Last edited:
Fair example fibonelli. Oscillator divergence at an identifiable level of potential resistance.

So divergence suggests a slowing in momentum/acceleration which results in any resting opposing orders from market participants at a level of potential support/resistance at which they believe price will be undervalued/overvalued if reached, finding it easier to overwhelm the current immediate price action trend. The self fulfilling nature of tech analysis providing the other opposing market orders to be executed by other market participants, on the back of their identification of both the support/resistance level and the oscillator divergence, resulting in at least a pull back/retracement in the current immediate price action, the extent to which depending on the market's idea of value at that time, and as may or may not be indicated by divergence/extreme readings on the longer time frames.
 
Last edited:
Hi, yeh, I've read quite a bit from Brett Steenbarger, Mark Douglas, Avi Frischer etc...

As for that extract, I'm not sure it represents emprirical evidence. There is no doubt that the masive growth in the use of pc's and software has seen a huge growth in tech analysis as an alternative/complimentary tool to fundamental analysis over the last 20years.

Why would that extract not represent empirical evidence? It consists of a sample numbering in the low thousands. He is not claiming a statistical conclusion.

There is certainly a case to be argued that any anlysis is self fulfilling, and certainly tech analysis is to some extent. Ie It works beacuse sufficient market participants use the same tools and respond to an overbought oscillator or a fib level for eg.

Viz. psychological. Thus, probabilities, based on statistical tools and a Gaussian distribution will be flawed in fast markets. In a slow market, they can work, but therein lies the weakness and the trap.

Whatever the case, the only people I ever see that dismiss tech analysis generally fall into 2 categories, i) Those that have never used it, and ii) those that have and failed to make it work for them. Personally I have absolute emprirical evidence that it does work as I'm sure do many others, but it is just a tool in making rational trading decisions based around recognising repeatable patterns that on the balance of historical probabilities will result in a certain price movement.

Absolute empirical evidence based on a sample size of? Again that word "probability".......what is the probability? Based on what method of discovery? Calculated how?

Steenbarger presents a sample of X# of successful traders, none of which use traditional technical analysis..........this you account for how?

If Tech/A had a high success rate, would you not expect to see at least a representation of practitioners within this sample?
 
In reference to the Brett Steenbarger article:

He needs to learn the difference between flow traders who do not need to look at charts to make a lot of money, physical players who hedge themselves and make money from economies of scale, spread scalpers who look only for ticks and prop traders who have no other tools but fundamental reports, people they know in the business and price action on charts.
I have been in the trading business many years and have seen all these sectors. There is not a hedge fund manager I know of who does not use a chart these days. All the banks put out tech analysis reports daily now which are looked at by the various trading desks and all the clients.
 
ducatti998: would you mind if we kept to the subjevct of the thread which is a discussion of the essential elements of tech analysis, not a post mortem on whether it works or not. Those of us who know it works, know it works, personally I have no interest in convincing anyone who does not hold the same view.

Thanks.
 
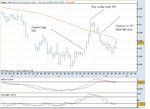
I am posting a chart of what I am doing today. So far netted 16 points on first trade. My trouble, as always, is trend. I'm using CC's 60 average at present, but only for trend direction, otherwise I read the bars. When I get a signal I trade, whether it is against the trend, or not. However, against it, I don't stay very long once the average is reached. Right now, I see that the price has fallen in my favour since I posted the chart.

Do you, or anyone,have any opinions and criticisms of all this? I'd love those 100 point moves, but grab small profits before I lose them, at present, simply because my signal triggers, against the trend, or not. Am I correct to do so , or should I give more time?

Should my stop now be at 283, the last high bar?

This is a foray into forex--I'm, normally an index trader.:confused:

Split
 

Attachments

  • Oct12 2007 GBP.USD.JPG
    Oct12 2007 GBP.USD.JPG
    72.3 KB · Views: 334
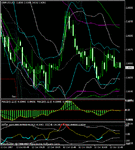
Re question: I thought that was a fair entry. Intraday trend was down and coexistent withn the weekly overall trend. Price had retraced sharply aking out the last lower swing hi on the 5min chart [0286] but found resistance ahead of the asian low/yesterdays low/area of the 23.6% fib of the fall from weekly highs at 0474/area of weekly s1 which was the bottom of the 15min last potential 'suppport becomes resistance zone.' ie at the last lower swing lo on 15min. Hidden/reverse divergence on the 5 and 15min oscillators added to the confluence of reasons to enter the market there. As for stop I would always seek to place outside of the last lower swing hi.

as for pip counts, it's not about pip counts it's about return on account, so that if you are finding a high strike rate in your trading you can be a little more aggressive with your leverage and therefore generate more £/pip. The big trades will come.
 
Last edited:
screenshot of above

screenshot is the 5min chart at time of your trade. You can see the hidden/reverse divergence in the oscillators (and some band deviation for good measure.)
 

Attachments

  • 5min.gif
    5min.gif
    18.9 KB · Views: 337
Yes, I see that. So far, for me, this has not been a great day but points have been gained, which is encouraging. Maybe the more experienced would identify it as a reason to take the morning off. Normally, I only trade mornings due to work schedule. However, today is a holiday in Spain, which allows me to go on for longer.

My short is still open.

Thanks for the posts. Much appreciated.

Split
 
Got stopped, I reversed here, as well. Am now long with a stop at 258. Don't want to bother your thread so will not post on this subject anymore.

Thanks again.

Split
 
Do you, or anyone,have any opinions and criticisms of all this? I'd love those 100 point

So do I but you have to wait for em my friend :D


Hi Splitlink ,

thats where your hiding

Looks OK to me,

I like to only take judged in line with trend only signals but not always if its a buzy day :LOL: :LOL: :LOL: , thanks for the trend line post :eek: a bit back I was upside down that day for sure.

Think your best not bothering with contra trends IMO, If you get it right you no deep down your fishing against trend so you won"t hold and capture the odd huge bounce or change of trend anyway you"ll be gone at the 1st sign of any trouble, which will be quick wrong if Long against the trend.

http://www.trade2win.com/boards/showthread.php?t=25049

Thats how I try to do it
 
Hi TWI, I absolutely concur with your comment about divergence, and in fact my own technical trading system/methodology is based around oscillator extremes/divergence with band/channel deviation at areas of support/resistance.

Divergence of course refers to the divergence between price and oscillators. Oscillators essentially measure momentum and like most tech indicators are calculated on past price, so lag current price action. An effective way to turn a lagging indicator into a potential leading indicator is it's divergence from price. Indeed Dr. Alex Elder for one, states that the strongest signal in tech analysis is macd divergence from price.

Be that true or not, oscillator extremes/divergence are a useful technical tool and are particularly useful in highlighting whether a potential supp/res area will more probably than not produce a reaction. One thing is for sure though, and that is that recognising divergence in the oscillators will be far more useful a tool if you can identify potential support/resistance and trend accurately.

I was interested to listen in to Wayne McDonnel of fxbootcamp during one of his regular free webinars via fxstreet.com speaking about his use of indicators. He stated that he uses a momentum oscillator to measure momentum of price, bollingers to measure volatility of price, price action and ma's to measure trend and stochastics to measure speed of price.

Hi,

Sorry we appeared to knock your thead off course,


Do you find that the divergence you refer to is best used for trade set up at support or Resistence. I do not use any instruments etc (do peak at rsi to make sure I am not at extreme) to set up trade. I found and assume I must have been useing them wrong that , well they would stay diverged for ages at tops and they worked a little better at bottoms. I never persisted with instuments and well always wonder when I see / read posts refering to them. Not against them just never been able to work them out and obviously require instruction :LOL: :LOL:
 
Top