Current Charts you find interesting

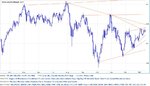
Volume analysis charts on the S&P 500 and Russell 2000 from effectivevolume. It differentiates between large institutions and individuals. Shows that large players have come in on the long side since the beginning of the month. But could just be hedging of short positions. There's isn't anyway to tell, but interesting none the less.

attachment.php

attachment.php

attachment.php
 

Attachments

  • SPY_ev.gif
    SPY_ev.gif
    14.3 KB · Views: 608
  • IWM_ev.gif
    IWM_ev.gif
    15 KB · Views: 599
  • SDS_ev.gif
    SDS_ev.gif
    13.4 KB · Views: 600
EUR/USD climbed after China announced that it will set up a $300billion investment vehicle made up of two funds (for the U.S. and Europe)
 

Attachments

  • eurusd.jpg
    eurusd.jpg
    25 KB · Views: 177
AUD/USD daily chart is confirming that more downside is possible. it closed below 1.0090, pulled back to 1.0160 and dived again...sell on rallies to go to 0.9820
 
well it was down to 0.9860, now it seems a good time for retracement

AUD USD just seems to be 'winding up' lower Swing highs and higher Swing lows for three months on the daily timeframe. Unlikely to break until next year?
 

Attachments

  • aud usd winding up.gif
    aud usd winding up.gif
    33.5 KB · Views: 174
AUD USD just seems to be 'winding up' lower Swing highs and higher Swing lows for three months on the daily timeframe. Unlikely to break until next year?

we had a nice move since the pair hit 0.9860 area...I am cautiously bullish atm...
 

Attachments

  • audusd13jan.jpg
    audusd13jan.jpg
    82.6 KB · Views: 208
Top