Re-entering a trend

Did you notice how that 15min 0387-0422 15/30min sbr zone held and price then made a lower low than the lower swing low extreme of that sbr zone, ie the 0387. price retracing up off 0374 area up to 0395 to make a new 5min (intermediate) sbr zone, as price sells again lower to 0358 before a retrace back into this new 5min 0375-95 sbr zone before selling down again at 0389 to make a low at 0339 before a further retrace.

Ie: We can use this new 5min (intermediate sbr zone) sbr beacuse the higher time frame sbr zone held and price made a lower low than it's lower low, ie 0374 over 0387.

This is an advanced technique, so don't worry if you don't get it. Hope the clarifications in one of the posts above help.
 
Thanks for the running commentary, bb, this a really helpful way of describing the flow. I have a couple of questions.

At what point do you decide that price is not in a range anymore? Or, going back a step, is the fact that price is in a range relevant at all to you, or do you just follow the sbr zones within the range come what may? I ask because I find that once I have drawn the range lines on the chart, it starts to influence and constrain how I view the price movement.

And also, do you attach any significances to the touch points on the line I have drawn in on the chart, which marked the 2.0416 roll over. Do you look for such things as part of your analysis? or do you consider these touches as less helpful ( more of a coincidence) than the sbr zones?
 

Attachments

  • 0710032222 30 min sbr.png
    0710032222 30 min sbr.png
    20.3 KB · Views: 162
Thursday

Fish: Ill answer your questions when I have more time, this will be my only post today.

Just wanted to discuss the price action in gbpusd this morning and specifically when the highest probability time was to re-enter the trend.

Well until the last lower swing low and lower swing high of the longer time frame had been exceeded, then the only trend that you would have been re-entering in the move up from the lows in gbpusd this morning was the intermediate. The last30min SBR zone in the down trend was 0315-0282, and when this was exceeded you were then re-entering the longer time frame up-trend. the 5min (intermediate) rbs zones in the new longer t/f up-trend therefore became 0303-0317, then 0313-0336.

Personally the first re-entry I took was at 1044am from 0319ask entry after the retrace down from 0336 area, as then that last 0308-0330 15/30/1hr sbr zone of the downtrend had been exceeded too.

Boe/Mpc rate announce , followed by ECB rate announce, then Trichet press conference at same time as U.s Initial/cont claims data, U.s factory orders and some minor speeches later.

Good luck all.
 
Last edited:
Just time for a quick post to confirm that the rbs zones on the 5min intermediate chart in the 30min+ uptrend today were as follows

0303-0316
0313-0336 (also a 15min rbs zone)
priice then retraced into the first rbs zone to form a new 5 and 15min rbs zone as price exceeded the high: (it actually found support at or about the last 15min significant lower swing hi in the original earlier downtrend, ie a lower swing hi that resulted in a lower swing lo, ie it was the last failed sbr zone 0308-0278 on the next time frame up - the 15min (from the inetermediate 5min,) in that earlier continuation of the downtrend, it's lower swing lo being the current low of the day. Remember that if the intermediate sbr/rbs zone doesn't hold it we look for the next time frame's last sbr/rbs zone, and even though this one failed to see a continuation of the downtrend, it's extreme did form the bottom for the day so far.

0305-0343
0318-0364 (also a 15min rbs zone)
0352-0385 (also a 15min rbs zone)
and then a minor rbs zone:

0390-0402.

Will answer all outstanding questions soon.
 
reply to Fish

Hi Fish, answers to your questions below:

1. Price is no longer ranging when the extreme of the range is broken and then that new higher high or lower low results in a higher low or lower high after a retrace. A range is a mish-mash of higher lows, higher highs, lower lows and lower highs, whereas a trend is a definate mixture of, in say an uptrend example, higher swing highs, and higher swing lows.

For me, I determine what my longer time frame and intermediate time frames are doing then act accordingly. I also determine whether any trend is co-existent or against any trend on time frames outside my triple time frame methodology. Ie it may be that my intermediate and longer time frame charts are trending (for me 5min and 30min respectively) but the next time frame, the 1hr is in a definate range. Trend would become stronger if this range on this time frame was broken in the direction of the 5/30min trend of course, but the extremes of that range are noted as possible supp/res areas. Additionally the previous significant swing his and lows on the longer time frames (1hr 4hr daily) can be importnat areas again and I like to note these.


2. As for an area being hit, like that 0416 example....conventional tech analaysis tells us that the more times an area is hit the stronger it becomes and therefore likley again to act as either supp or res or res or supp if breeched then re-tested from the other side.

-------------------------------------------------------------------------------------------------

For any trader who lacks the volume to move a market, the next best thing we can do is understand where the market is most likely to react with bids/offers, and more specifically where the market movers are most likley to react. In forex that is the institutional players. The concepts of support/resistance/sbr/rbs are key to successful swing trading. Effectively that is what this trend re-entry via sbr/rbs is, and my personal preference is to adapt and apply it to the intraday market.

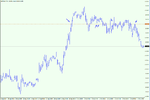
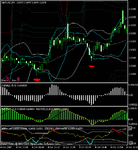
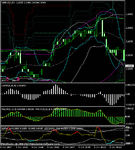
Now look at the attached 4hr chart, the aqua coloured * marks show the 2 higher highs and the pink *'s show the 2 higher lows, in an obvious uptrend on that chart...so you can see at todays bottom that although we were in a downtrend on charts up to 1hr, we had hidden/reverse divergence in the oscillators on that chart and deviation from the bollingers (aqua and white.) When price started trending up from today's lows it was no surprise therefore when the uptrend developed surpassing the last significant lower swing high on the hourly chart at 0330 area (significant because the lower swing high resulted in a lower swing low at today's lows.) In breaking up through that lower swing high of the downtrend price had broken the last sbr zone of the downtrend on that 1hr chart, ie 0306-0330.

I should stress that as with any methodology, disparate traders will find the way that it works for them , or not. This is the way I trade and analyse the market. Once you are re-entering a trend on your longer time frame chart, which for me is 30min, I want to know how that trend fits in or not with the trend on charts above that, which is why I take notoce of the general picure on those other charts.
 

Attachments

  • 4hr.gif
    4hr.gif
    31.4 KB · Views: 195
Just a post to explain what technical tricks you can use to help pinpoint an entry using this sbr/rbs zone trend-reentry methodology.

You will see on the attached screencap at the red marks that on each re-entry at an rbs area in this uptrend that you had a. hidden/reverse divergence in the oscillators and b. Deviation from the 2 bollingers.

If your last intermediate sbr/rbs zone fails and you have identified your next time frame's sbr/rbs zone, then it is likley that you will get a set-up on your intermediate with hidden/reverse divergence that you can time on your trigger that will likley be showing oscillator extreme or regular divergence readings, on that trigger chart.
 

Attachments

  • reentry tech.gif
    reentry tech.gif
    17.6 KB · Views: 208
Subdued activity in the London session so far, ....U.s Colombus day bank Holiday of course so less market participants driving moves.

Asian/overnight session saw a tight 0403-0429 range below the Friday 0442 post NFP highs. Price broke to the short side before re-entering the range finding resistance for a further break to the short side. Below that range the 5min intermediate formed an SBR zone at 0367-0390 before a further break to todays lows at the 50% of the move up from Thursday lows to fridays highs 0278-0442. Resistnace found in that 5min SBR zone but a higher low resulted and price currently trades around 0387-90.
 
Last edited:
attached is the screenshot of the 5min chart highlighting the confirming intermediate set-up in the sbr zone mentioned above. Notice how there was deviation from the 10 and 20 bol (aqua and white) and hidden/reverse divergence in the oscillators.

The doji candle at the bottom signified the area where a higher low was made on that chart taking out the top of the SBR zone, ie the previous lower swing high in the downtrend.

Remember you can use this triple t/f rbs/sbr trend entry methodology on any sensible combination of time frames, and i will summarise the methodology again in bullet point form later this week.
 

Attachments

  • 5min intermediate.gif
    5min intermediate.gif
    17.5 KB · Views: 166
Over on forexfactory.com hey had a 'guess the NFP' number on Friday comepetition, the actual came in at 110,000 (with upward revisions to previous months totalling 118,000. )The winner of the competition guessed 109,443 !! and then stated that he used the following equation:

'.....If you take the value of the ADP Actual and devide it By the ADP estimate and the take the Product and Multiply it by the NFP estimate You come up with 109,433.'

Spooky/clever/complete fluke ?? time will tell, Lol.
 
I just went back and tested 07 numbers and it appears he just got lucky. Most give wildly different results to actual NFP.
 
mon cont....

Thx TWI (thought it was too good to be true, lol.)

Interesting today cable finds resistance now at the bottom of the asian range 0403-0429, on the run up from todays lows at that 50% fib mentioned in a post above, and a great set-up on the 1min trigger confirmed on the 5min intermediate and indeed 15min.

Attached are 3 screenshots, the first shows what I call a Reversal type C(oneof my Reversal set-ups) notice the regular immediate bearish divergence in the oscillators. The second shows the 5min confirming set-up and here too it's a Revrsal type C, again notice the oscillator divergence. As a further confirmation, there was what I call a Reentry type 2 on the 15min chart (ie a lower high showing hidden/reverse divergence and band deviation.)

Essentially the entry set-up was a Reversal against the 1 and 5min trends and a Rentry into the 15min. There was hidden/revrese divergence too in the 30min oscillators as a further confirmation of a high probability entry point to the market.

BTW: these 'Reversal' and 'Re-entry' set-ups are decribed in the documents attached to this thread: http://www.trade2win.com/boards/showthread.php?t=25770
 

Attachments

  • 1min.gif
    1min.gif
    17.3 KB · Views: 193
  • 5min.gif
    5min.gif
    17.3 KB · Views: 174
  • 15min.gif
    15min.gif
    18.2 KB · Views: 149
RBS/SBR zone trend re-entry method: bullet point summary

1. Determine your time frames using a factor as close to x5 as you can get, ie:

a. Trigger
b. Intermediate
c. Longer

For eg, I use 1min, 5min, 30min respectively, but 15m/1hr/4hr, 4hr/Dly/Wkly are other combinations.

Determine then what is happening on your intermediate and longer timeframes (+.) If these time frames are trending, then they will have either

i) Broken out of an obvious range on the longer time frame

-or-

ii) Be making obvious higher swing lows and higher swing highs in an uptrend, or lower swing highs and lower swing lows in a downtrend.

Then:

Assuming a downtrend as an example:

1. Look at your intermediate chart and determine where the last broken lower swing low and above that the last lower swing high is. This is your potential SBR zone. (support becomes resistance)

2. Note too the last SBR zone on the next time frame up/your longer time frame.

3.
Note any significant poiunts within that SBR zone.

4. Await a pullback to the SBR zone and if re-entering the trend, ensure your stop is outside of the extrme of that SBR zone, ie it's lower swing hi.

** Should this SBR zone fail and price exceeds its lower swing Hi extreme, making a deeper pullback look for Resistance now in the next time frame/longer time frame's last SBR zone.

Reentries to trends that exist on charts beyond your longer time frame are potentially stronger, but be aware also that the stronger the trend, measured in this way, the greater the chance of a 'deeper pullback.' Reentries to only your inetrmediate chart trend carries potentially greater risk than if to your intermediate and longer time frame trend+.

In terms of technical set-ups, effectively you are looking for hidden/reverse divergence/extremes coupled with band/channel deviation in an SBR/RBS zone. On a deeper pullback you will note that the trigger oscillators are likely to be extreme/showing regular divergence and the intermediate oscillators showing hidden/reverse divergence.

Thats the RBS/SBR zone methodology in a nut-shell. The only other high probability re-entry to a trend that I use are the thrust candles on the 15min+ in the right circumstances. B/O's, Indicator reading based (rsi going above 50, cci above zero lone for eg...) Beacause it looks as though it might, Break of Supp/Res areas are other technical methods to re-enter a trend, but ones that I personally do not favour. Others may be more sucessful using them.
 
It is more probable than not, that if your last intermediate RBS/SBR zone matches that of your next time frame/longer time frame, (+) then that zone will be stronger. It is however unlikely that the intermediate SBR/RBS zones ever match those extending more than 1-2 time frames above it. Remember that SBR/RBS zones generally really need to have some opposite candles in them. Ie in a downtrend example the retrace/pullback should show some bullish candles.
 
Tuesday

Tuesday sees a downside break out of the 0326-0370 asian range, seeing a minor 5min SBR range forming at 0288-0303 area. Above here andf there are 2 15/30min sbr zones at 0323-0351, and 0330-0375.
That asian low, Mondays low and the 23.6% of the move down from fridays 0442 highs to todays 0288 lows all in that 0326-31 area.

Price finding resistance in this last 5min sbr zone atm, price currently trading at 89bid, near the lows
 
Tues cont

Price recording a slightly lower low on the day at 0285/86 following that leg down from the 5min SBR zone mentioned above, and specifically Friday's lows area.

MNi talking of key technical support at 0259 and bids ahead of it at 0280/70. 0278 last weeks lows of course and 0256 is 38.2% fib of 9873-0492 move.
Offers now building around that 0325 level discussed in post above,according to Mni.

Fomc minutes and U.s Budget defecit due later.
 
Last edited:
tues cont ...

New lows at the support menioned above. Mni mentioning now that 0250 is the Daily 21ma . That last 5min sbr zone stands and is a minor 15min sbr zone now. the last 2 main 15/30/1hr sbr zones though are mentioned above, for potential resistance on any deeper pullback.

91 the hi-lo pip range so far today, still well below the 5/10/20 day averages which range between 140/119/150 respectively.
 
slow stochs to 4hr are all in the extreme o/s areas at this level now. Remember though that these can stay o/s or o/b when price trends, but useful readings to get some pips at pullbacks at known support areas.
 
Price finding Resistance again in that last sbr zone on 5min intermediate, which was also a minor 15min sbr zone too, making new lows. Specifically at the 23.6% fib of todays move down which resided in the area of Wkly s1 pivot and friday's lows. Area of 0300 were former bids, which added to the SBR confluence. Notice the hidden/reverse divergence at that time in 5min oscillators and stochs on 1 and 5 were extremely overbought.

The new 5/15min sbr zone becomes 0269-0296.

Stochs remain in extreme oversold territory 30/1hr/4hr with the smaller time frames more prone to oscillation with intraday price moves.
 
new lows at that support area mentioned above, the 38.2 fib of the 9873-0492 move also coinciding with the 76.4% extension of yesterdays move down. The support is also the area of today's 2nd camarilla L3 b/o target, ie Lf at 0255.

Mni talking about stops through to 0240 which if triggered opens up potential further downside.
 
Hi bbmac,

I've downloaded your excellent documents regarding your trading setups.

Looking at the charts that you post, I'm curious to know why do you use OSMA and MACD to get your signals in place of Slo Sto or SMI indicators?

Thank you

Fibonelli
 
Top