I've been experimenting with getting more accurate MACCI 10 triggers and have found the following set of rules filter out alot of false MACCI10 trades.
A way of getting more accurate MACCI10 triggers using three moving averages
The answer to all the following questions must be yes to take a trade.
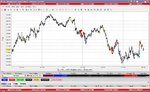
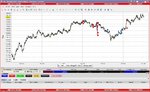
1) Are the 5 period, 20 period and 200 period Moving averages on the daily chart all pointing in the same direction?
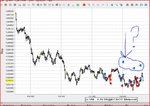
2) Are the 5 period, 20 period and 200 period MA on a 10 minute DOW chart trending in the direction of the broader market?
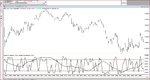
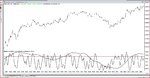
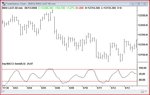
3) Is the MACCI 10minute overbought or oversold that we believe there is a high probability of a change in direction of the market to that of the 200, 20 and 5period MA on both the daily and 10 minute charts?
4) Are AMZN, RIMM or AAPL charts showing the same setup as the DOW then short or long AMZN, AAPL or RIMM in direction of the market.
5) Use a change in trend of the 5 period MA on the 10 minute chart for intraday stop, along with the MACCI 10 divergence. If MACCI 10 is oversold and turning up but the 5 period keeps trending down, do not close the trade until the 5 period turns up.
6) The above can be used to time a swing trade entry too.
Luckybucks