Hi bbmac, your posts are very detailed and informative, thank you for posting them. Since you have been analysing this pair for some time I was wondering if you could help me out - on the daily charts where do you think this high/low could retrace to? my high is 1.6875ish and low is 1.622. I am trying to build skills on creating analysis for what fib level a swing move is likely to retrace to and would greatly appreciate any input you may be able to give.
You are using an out of date browser. It may not display this or other websites correctly.
You should upgrade or use an alternative browser.
You should upgrade or use an alternative browser.
- Status
- Not open for further replies.
bbmac
Veteren member
- Messages
- 3,584
- Likes
- 789
answer to question
Hi, Thank you for your comments,...well in light of my post and subsequent posts since post #351, I didn't know whether your question was loaded with irony? The answer to your question is that price could go anywhere, and for me to speculate where would suggest that I have predictive analysis, which I don't. On that Daily t/f there is a perfect bullish pinbar which implies rejection of that lower 4hr/Daily t/f previous swing lo=prev support=potential support zone detailed in previous posts. Price has already pulled back 38.2%/50% of the recent 6876/6744-6269 (Friday Lo) moves respectively with the higher 50%/61.8% of those moves @ 6573/6563 respectively...maybe this is the bull target? ...I have no idea..certainly the 1hr is in an overall price action uptrend and the move off Friday's low was a strong one. The best advice is to trade what you see, not what you think. As for you building up skills to create analysis for what fib level price might retrace to-this falls into the predictive ..so for me I will determine if any trend has/is developing on the t/f's of interest to me because of the pullback/extended pullback/reversal in a longer swing move and act according to my trading edge.
G/L
Hi bbmac, your posts are very detailed and informative, thank you for posting them. Since you have been analysing this pair for some time I was wondering if you could help me out - on the daily charts where do you think this high/low could retrace to? my high is 1.6875ish and low is 1.622. I am trying to build skills on creating analysis for what fib level a swing move is likely to retrace to and would greatly appreciate any input you may be able to give.
Hi, Thank you for your comments,...well in light of my post and subsequent posts since post #351, I didn't know whether your question was loaded with irony? The answer to your question is that price could go anywhere, and for me to speculate where would suggest that I have predictive analysis, which I don't. On that Daily t/f there is a perfect bullish pinbar which implies rejection of that lower 4hr/Daily t/f previous swing lo=prev support=potential support zone detailed in previous posts. Price has already pulled back 38.2%/50% of the recent 6876/6744-6269 (Friday Lo) moves respectively with the higher 50%/61.8% of those moves @ 6573/6563 respectively...maybe this is the bull target? ...I have no idea..certainly the 1hr is in an overall price action uptrend and the move off Friday's low was a strong one. The best advice is to trade what you see, not what you think. As for you building up skills to create analysis for what fib level price might retrace to-this falls into the predictive ..so for me I will determine if any trend has/is developing on the t/f's of interest to me because of the pullback/extended pullback/reversal in a longer swing move and act according to my trading edge.
G/L
bbmac
Veteren member
- Messages
- 3,584
- Likes
- 789
Mon 30th Nov 09
Last day of month and a generally bullish asian/overnight session see-ing a hi of 6590 (between 100 and 200 sma's on 1hr/4hr) before a pullback to Friday's Hi (=1hr prev swing hi=prev res=potential rbs zone) and further demand. London starting bullish too...no HH above that 6590 asian hi yet though..
Uk Data at 0930am
G/L
bbmac
Veteren member
- Messages
- 3,584
- Likes
- 789
Potential sbr/res cluster?
The 4hr chart below shows that the bottom prev sw lo=prev supp=potential sbr zone [co-existant on 1hr] has the 100sma on this 4hr as qwell as the 61.8% fib of the 6876-6269 move...could be some supply in the area? Will see if any good set-ups develop/Mni suggesting offers there ..should price reach area in near-term...in the meantime buying the dips in 5min ascending channel seems to be the most prevalent lower t/f pattern.
G/L
bbmac
Veteren member
- Messages
- 3,584
- Likes
- 789
supply at top of 5min ascending channel
Clearly some supply at top of 5min channel, with some nice bearish thrust candles down on 1min as price drops sharply and a perfect 5min bearish thrust candle close results (0745am 5min candle.) 5min fibo channels were descending into price (yellow line) at that channel top Hi..Nice play as 1/5/15/30min/1hr macd signal lines pointing down


Clearly some supply at top of 5min channel, with some nice bearish thrust candles down on 1min as price drops sharply and a perfect 5min bearish thrust candle close results (0745am 5min candle.) 5min fibo channels were descending into price (yellow line) at that channel top Hi..Nice play as 1/5/15/30min/1hr macd signal lines pointing down
Last edited:
bbmac
Veteren member
- Messages
- 3,584
- Likes
- 789
Bearish correction from current i/day Hi
Break of 5min ascending channel and those bearish thrust candle plays on 1/5min (see above post) sees a pullback from 6474 area now finding resistance/sbr at the prev 1hr swing lo=prev supp=potential sbr zone, co-existant with 38.2% of i/day fall to 6474 and offers to 6520-mni,...1hr t/f re potential supp/res/sbr/rbs is below...a HH, HL, LH now a L on that t/f so not yet a bearish trend re overall price action-peak/valley analysis.

G/L
Break of 5min ascending channel and those bearish thrust candle plays on 1/5min (see above post) sees a pullback from 6474 area now finding resistance/sbr at the prev 1hr swing lo=prev supp=potential sbr zone, co-existant with 38.2% of i/day fall to 6474 and offers to 6520-mni,...1hr t/f re potential supp/res/sbr/rbs is below...a HH, HL, LH now a L on that t/f so not yet a bearish trend re overall price action-peak/valley analysis.
G/L
bbmac
Veteren member
- Messages
- 3,584
- Likes
- 789
pullback from 6474 lows
The pullback from the 6474 area lows has been largely unaffected by the Uk data @ 0930 (so far.) That 6474 fell just short of the prev sw lo=prev support=potential support zone on 1hr, mni saying beforehand that '..bids to 6470, stronger into 6460 with likely stops below..' - would make sense...No 1min Reversal set-up @ those lows but a decent 5min oscillator extremes/cci hook based reversal extreme set-up, and a 30min supporting hidden divergence based Re-entry (to higher t/f trend after a pullback) set-up..see pic below;

This Re-entry set-up came @ a L on the 30min co-existing with a HL on the higher t/f into whose uptrend the Re-entry indicated a chance to get with trend..and as price pulled back from those 6474 lows..initial H above the last LH of the 5min downtrend saw price retest the 5min prev swing hi (the LH) zone shown below...

A 1min Re-entry (to next higher t/f t/f trend after a pullback) set-up developed @ that potential 5min rbs zone...there was really no established 5min uptrend at that point but possible the beginning of one after a H above the last LH of it's downtrend, following a HL, and then this the 2nd HL so I took a chance at a reduced volume, coming out just before the 0930am data hit for a decent pip gain. (This set-up was also imperfect because the 5min macd signal line although pointing up like the 30min, was not crossed above it's axis)

Price has now pulled back off the 61.8% of the current i/day fall -6593-6474, at which point a decent 1min osc extremes/cci hook based Reversal set-up developed @ 6544 area;

G/L
The pullback from the 6474 area lows has been largely unaffected by the Uk data @ 0930 (so far.) That 6474 fell just short of the prev sw lo=prev support=potential support zone on 1hr, mni saying beforehand that '..bids to 6470, stronger into 6460 with likely stops below..' - would make sense...No 1min Reversal set-up @ those lows but a decent 5min oscillator extremes/cci hook based reversal extreme set-up, and a 30min supporting hidden divergence based Re-entry (to higher t/f trend after a pullback) set-up..see pic below;
This Re-entry set-up came @ a L on the 30min co-existing with a HL on the higher t/f into whose uptrend the Re-entry indicated a chance to get with trend..and as price pulled back from those 6474 lows..initial H above the last LH of the 5min downtrend saw price retest the 5min prev swing hi (the LH) zone shown below...
A 1min Re-entry (to next higher t/f t/f trend after a pullback) set-up developed @ that potential 5min rbs zone...there was really no established 5min uptrend at that point but possible the beginning of one after a H above the last LH of it's downtrend, following a HL, and then this the 2nd HL so I took a chance at a reduced volume, coming out just before the 0930am data hit for a decent pip gain. (This set-up was also imperfect because the 5min macd signal line although pointing up like the 30min, was not crossed above it's axis)
Price has now pulled back off the 61.8% of the current i/day fall -6593-6474, at which point a decent 1min osc extremes/cci hook based Reversal set-up developed @ 6544 area;
G/L
Last edited:
bbmac
Veteren member
- Messages
- 3,584
- Likes
- 789
30min/1hr downtrend established with LL
The recovery from 6474 shiown in posts above finds a LH @ 6544 and a new LL results on 30min, establishing now it's overall price action downtrend...price pullsback off the LL @ 6454, (1 and 5min Regular divergence based Reversal set-ups here, 5min shown below)

...to a pullback Hi in the prev 1hr swing lo=prev supp=potential sbr zone shown below

and a Good 1min reg div Reversal set-up supported by the 5min hidden-div Re-entry set-up results...5min shown below;

Price is descending in somewhat of a 15min channel presently?

G/L
The recovery from 6474 shiown in posts above finds a LH @ 6544 and a new LL results on 30min, establishing now it's overall price action downtrend...price pullsback off the LL @ 6454, (1 and 5min Regular divergence based Reversal set-ups here, 5min shown below)
...to a pullback Hi in the prev 1hr swing lo=prev supp=potential sbr zone shown below
and a Good 1min reg div Reversal set-up supported by the 5min hidden-div Re-entry set-up results...5min shown below;
Price is descending in somewhat of a 15min channel presently?
G/L
bbmac
Veteren member
- Messages
- 3,584
- Likes
- 789
Fall continues
It's been a sell the rally kind of day off today's current 6593 i/day hi as the 5min, 15min, then 30min/1hr t/f's developed an overall price action peak/valley analysis downtrend, price now @ 121% of it's average 20day pip range. The latest hidden-divergence based Re-entry 9to higher t/f trend after a pullback) set-up developed on the 5min after the pullback from current 6378 LL on 30min/1hr downtrend, and is shown below;

The current 1hr chart in respect of near-term obvious potential supp/res factors is shown below and the red/blue zones are co-existant on 4hr. The solid line yellow fib is the 6744-6289. The 100sma (yellow) remains below the 200sma (red) on this t/f.
G/L
It's been a sell the rally kind of day off today's current 6593 i/day hi as the 5min, 15min, then 30min/1hr t/f's developed an overall price action peak/valley analysis downtrend, price now @ 121% of it's average 20day pip range. The latest hidden-divergence based Re-entry 9to higher t/f trend after a pullback) set-up developed on the 5min after the pullback from current 6378 LL on 30min/1hr downtrend, and is shown below;
The current 1hr chart in respect of near-term obvious potential supp/res factors is shown below and the red/blue zones are co-existant on 4hr. The solid line yellow fib is the 6744-6289. The 100sma (yellow) remains below the 200sma (red) on this t/f.
G/L
bbmac
Veteren member
- Messages
- 3,584
- Likes
- 789
Tues 1st Dec 09
November monthly candle closes as a bullish spinning top, the November pip range contracting to 53% of it's 12month average.
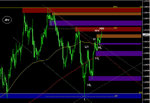
The current 1hr chart in respect of the potential supp/res factors is a tale of the 76.4% fibs, currently price finding some supply at the 76.4% of the fall from y/day's hi to today's asian lo/current i/day lo (6593-6378) - the pinbar (circled) showing the rejection of that previous 1hr swing lo=prev supp=potential support zone as london opened and rose strongly. The other 2 unbreeched fibs on this t/f are the 76.4% of the 6744-6289 move and the 76.4% of the 6269-6593 rise.

G/L
November monthly candle closes as a bullish spinning top, the November pip range contracting to 53% of it's 12month average.
The current 1hr chart in respect of the potential supp/res factors is a tale of the 76.4% fibs, currently price finding some supply at the 76.4% of the fall from y/day's hi to today's asian lo/current i/day lo (6593-6378) - the pinbar (circled) showing the rejection of that previous 1hr swing lo=prev supp=potential support zone as london opened and rose strongly. The other 2 unbreeched fibs on this t/f are the 76.4% of the 6744-6289 move and the 76.4% of the 6269-6593 rise.
G/L
Last edited:
bbmac
Veteren member
- Messages
- 3,584
- Likes
- 789
5min Re-entry to upmove after a pullback from 76.4% fib
The pullback from the 76.4% 6593-6378 finds fresh demand and a hidden-div based Re-entry (to next higher t/f trend after a pullback) and although that next higher t/f not in a strict overall price action uptrend, see-ing a L then H, the move up has been strong and 5min is in a n uptrend. The set-up developed @ a HL on 5min and 30min and has seen a 'with trend' follow thru to a new HH in the 5min uptrend, and a H in the 30min upmove. At the time of entry the 30min+ macd signal lines were pointing up, and entry was on the 5min candle close as there was no corresponding 1min Reversal set-up
The move up from 6378 is currently @ 96% of the 20day average pip range.
Starting with yesterday's Low 1hr has seen a LL, LH, HL, = LH, L and now a H and the recent 1hr descending trend line is breeched to the upside

G/L
The pullback from the 76.4% 6593-6378 finds fresh demand and a hidden-div based Re-entry (to next higher t/f trend after a pullback) and although that next higher t/f not in a strict overall price action uptrend, see-ing a L then H, the move up has been strong and 5min is in a n uptrend. The set-up developed @ a HL on 5min and 30min and has seen a 'with trend' follow thru to a new HH in the 5min uptrend, and a H in the 30min upmove. At the time of entry the 30min+ macd signal lines were pointing up, and entry was on the 5min candle close as there was no corresponding 1min Reversal set-up
The move up from 6378 is currently @ 96% of the 20day average pip range.
Starting with yesterday's Low 1hr has seen a LL, LH, HL, = LH, L and now a H and the recent 1hr descending trend line is breeched to the upside
G/L
bbmac
Veteren member
- Messages
- 3,584
- Likes
- 789
2 x set-ups
A shallow pullback off Daily R1 pivot creates a 1min Re-entry to 5min uptrend after the pullback, followed by a 1min Reversal set-up (note the double regular immediate bearish diverghence in osma) this set-up was supported by a Reversal set-up on 5min (not shown) and came at the top of the prev 1hr swing hi=prev res=potential res zone shown below:
Price is now at 104% of it's 20day average pip range.
G/L
The 1min set-ups are here:

The 1hr potential res zone is here:

A shallow pullback off Daily R1 pivot creates a 1min Re-entry to 5min uptrend after the pullback, followed by a 1min Reversal set-up (note the double regular immediate bearish diverghence in osma) this set-up was supported by a Reversal set-up on 5min (not shown) and came at the top of the prev 1hr swing hi=prev res=potential res zone shown below:
Price is now at 104% of it's 20day average pip range.
G/L
The 1min set-ups are here:
The 1hr potential res zone is here:
bbmac
Veteren member
- Messages
- 3,584
- Likes
- 789
1hr/4hr potential resistance zone tested..
Another leg up and price arrives in the red zone shown in 1hr screenshot in above post, a 1hr previous swing hi=prev resistance=potential resistance co-existant with an obvious near-term previous swing hi on 4hr...a nice 1min trigger t/f regular bearish divergence based Reversal set-up develops giving a hi-probability 'against trend' trading opportunity @ a hi of 110% of the average 20day pip range for the instrument..

G/L
Another leg up and price arrives in the red zone shown in 1hr screenshot in above post, a 1hr previous swing hi=prev resistance=potential resistance co-existant with an obvious near-term previous swing hi on 4hr...a nice 1min trigger t/f regular bearish divergence based Reversal set-up develops giving a hi-probability 'against trend' trading opportunity @ a hi of 110% of the average 20day pip range for the instrument..
G/L
bbmac
Veteren member
- Messages
- 3,584
- Likes
- 789
Weds 2nd Dec 09
The pullback from the previous 1hr/4hr swing lo=prev support=potemtial sbr zone at yeasterday's Hi (circled) found fresh demand @ 6548 in the early London session, reversing the asian/overnight pullback with an upside break of the Weds hi to a new Hi @ 6682.
Price is currently in an uptrend to the 4hr t/f and price trades above both the 200 and 100 sma's on 1hr and 4hr, having breeched the descending 4hr resistance trend line/channel top, and 61.8% of the recent 6876-6269 fall.
1hr as I see it presently is below, red and blue zones are co-existant on 4hr with the red zone at top of screenshot being co-existant with a minor prev swing hi opn Daily t/f too. Fibs on this t/f are plotted from 6269 and 6378 to current Hi.

G/L
The pullback from the previous 1hr/4hr swing lo=prev support=potemtial sbr zone at yeasterday's Hi (circled) found fresh demand @ 6548 in the early London session, reversing the asian/overnight pullback with an upside break of the Weds hi to a new Hi @ 6682.
Price is currently in an uptrend to the 4hr t/f and price trades above both the 200 and 100 sma's on 1hr and 4hr, having breeched the descending 4hr resistance trend line/channel top, and 61.8% of the recent 6876-6269 fall.
1hr as I see it presently is below, red and blue zones are co-existant on 4hr with the red zone at top of screenshot being co-existant with a minor prev swing hi opn Daily t/f too. Fibs on this t/f are plotted from 6269 and 6378 to current Hi.
G/L
Last edited:
bbmac
Veteren member
- Messages
- 3,584
- Likes
- 789
Monday's Daily Candle
Monday's candle showing why if you are going to trade a pinbar close (Friday's candle) as the trigger for market entry, stop has to be below it (in the case of a bullish pin, above it for a bearish pin-obviously.)
A badly places stop and you would be nursing losses not an effective 180pip gain from the pinbar close right now.

G/L
Monday's candle showing why if you are going to trade a pinbar close (Friday's candle) as the trigger for market entry, stop has to be below it (in the case of a bullish pin, above it for a bearish pin-obviously.)
A badly places stop and you would be nursing losses not an effective 180pip gain from the pinbar close right now.
G/L
bbmac
Veteren member
- Messages
- 3,584
- Likes
- 789
Th 3rd Dec 09
Price is in an uptrend on 1hr/4hr, a perfect uptrend on 4hr re overall price action see-ing 3 x HL and 2 x HH so far. price trades above the 100sma and 200sma on 1hr-Daily t/f although 1hr 100sma remains below 200sma. Aftre breaking through the 61.8% of the 6876-6269 move and the descending trend line/channel top on 4hr price has found supply in the 1hr/4hr/Daily previous hi swing=prev res=potential resistance zone that extends up to 6744, the 76.4% of 6876-6269 residing in that zone @ 6731.
G/L
Attachments
bbmac
Veteren member
- Messages
- 3,584
- Likes
- 789
Pullback from 6720
The pullback off 6720 created a 5min downtrend although that t/f has gone a bit rangy now per overall price action-peak/valley analysis. Price found support @ the 50% of the 6549-6720 swing up, just into the prev 4hr swing lo=prev support=potential support zone shown in post above.
The current near-term obvious potential supp/res factors on 1hr are on screenshot below. Red/blue zones are co-existant with prev obvious near-term swing hi/lo's on 4hr and the unbreeched fibs shown are from 6269, 6378 and 6549 to current 6720 hi.
G/L
Last edited:
bbmac
Veteren member
- Messages
- 3,584
- Likes
- 789
pullback continues...intraday bearish at the moment
Pullback off 6720 extends to test the topside of breeched previous 4hr descending resistance trend line/channel top with confluence of 23.6% 6269-6720 and 61.8% 6549-6720, where some demand was encountered...intraday sentiment reamins bearish correct at time of writing and on 4hr price has made a L below the last HL of it's uptrend.
U.s data due at 1330pm gmt.
G/L
bbmac
Veteren member
- Messages
- 3,584
- Likes
- 789
Roll up, Roll up!!
Tomorrow (Friday) the Monthly Circus that is U.s NFP is released at 1330pm gmt. As usual it will be the revisions from previous -190k #, the change in manuf jobs # (-48k forecast consensus -vs- -61k previous,) and un-emp rate (10.2% forecast consensus -vs- 10.2% previous,) as well as the headline # (-120k forecast consensus -vs- 190k previous.) that will determine market reaction. Often times the knee-jerk is not the actual direction the market ends up taking after digesting the data.
With ADP forecasting -169k losses (they are getting better!) and Goldan saying job losses won't bottom out til 2011, it is anyones guess, although the rate of decline in the jobs market does at the moment seem to be bottoming. It remains to be seen whether the loose U.s fiscal stance and increase in confidence can sustain this V shaped recovery or whether a W is more likely.
Whatever your stance for it , G/L
bbmac
Veteren member
- Messages
- 3,584
- Likes
- 789
Serendipity
Having finished my trading session at 12noon, I was at the desk preparing for tomorrow's session by updaing potential supp/res charts etc/writing the post above when the following 'perfect' hi-probability counter-trend trading opportunity presented itself...a 1min supported by 5min repeating regular bullish divergence based reversal set-up (s) in a previous 1hr/4hr swing lo=prev support=potential support zone with price @ 90% of it's 20day average pip range...nice pip gain!!
The potential 1hr/4hr support zone is here

....and the set-ups referred to above are here:

and supporting 5min set-up;

G/L
Having finished my trading session at 12noon, I was at the desk preparing for tomorrow's session by updaing potential supp/res charts etc/writing the post above when the following 'perfect' hi-probability counter-trend trading opportunity presented itself...a 1min supported by 5min repeating regular bullish divergence based reversal set-up (s) in a previous 1hr/4hr swing lo=prev support=potential support zone with price @ 90% of it's 20day average pip range...nice pip gain!!
The potential 1hr/4hr support zone is here
....and the set-ups referred to above are here:
and supporting 5min set-up;
G/L
- Status
- Not open for further replies.
Similar threads
- Replies
- 11
- Views
- 9K