These are the Economic Reports scheduled for release tomorrow, Friday Feb 27, 2027
PPI (Jan/Feb) at 8:30am ET Consensus is .3
Core PPI at 8:30am ET Consensus is .3
PMI at 9:45am ET Consensus is 52.2
My "Read" on what might happen
- Inflation Focus: The PPI data is the "headline release" for the day. Higher-than-expected producer inflation typically pressures S&P 500 futures as it signals persistent pricing power that may delay Federal Reserve rate cuts.
- Manufacturing Health: The Chicago PMI at 09:45 AM provides a regional snapshot of manufacturing activity shortly after the New York opening bell. A reading above 50 indicates expansion.
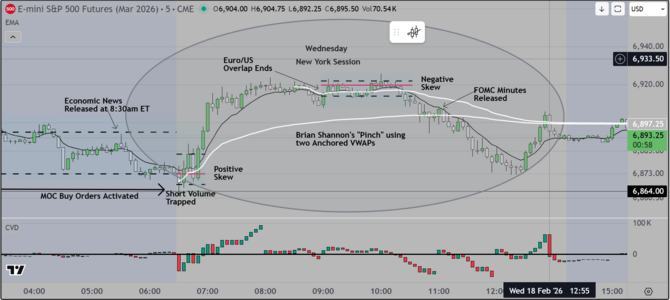
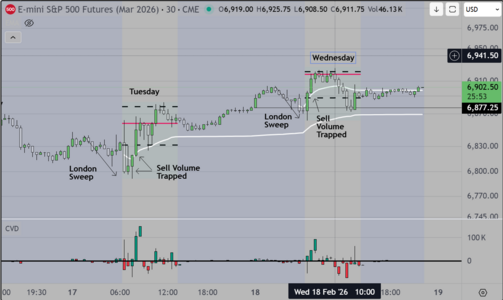
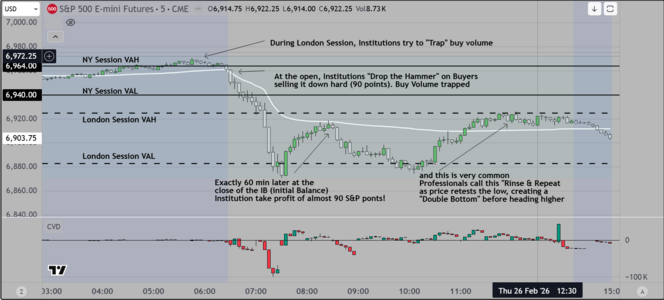
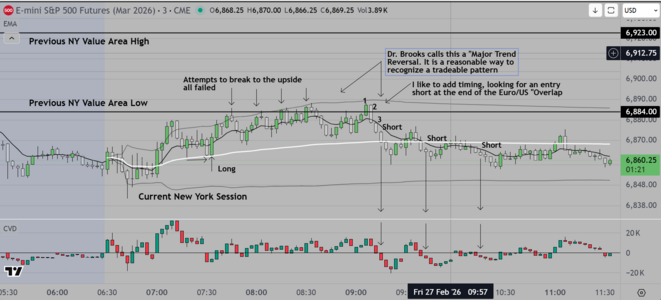
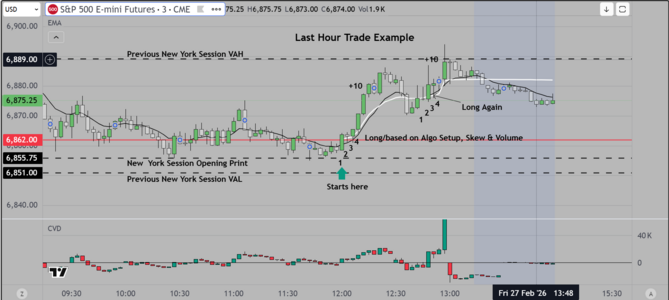
The market has been resilient, trapping sell volume, as Institutions move in to buy cheap inventory and sell it back at a premium
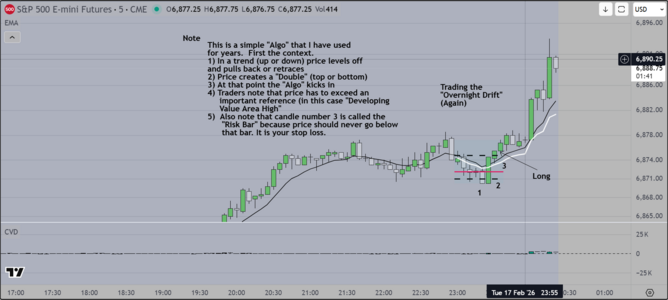
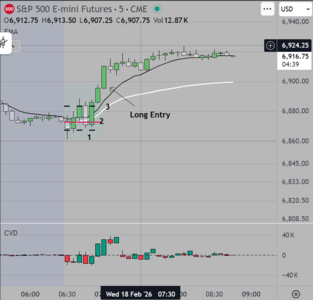
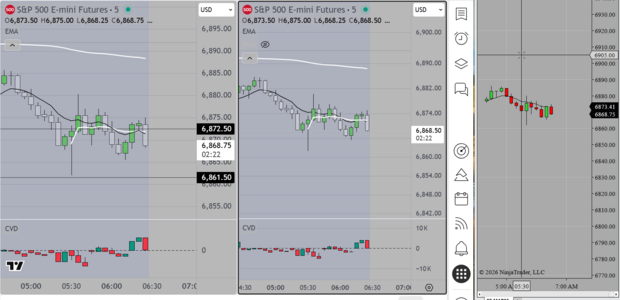
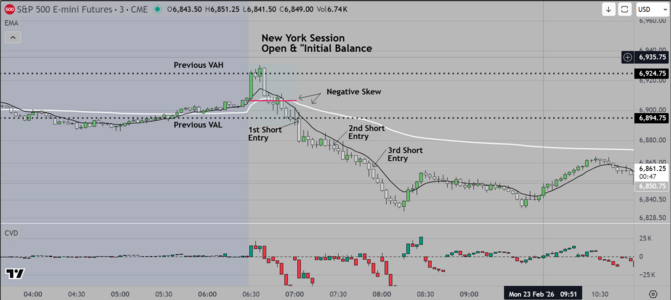
That seems to be how the game is being played. So what to do? In my opinion, just look at a chart using 5 minute bars or candles
and see (by time segment) how it is being manipulated. What happens during the first 30 minutes, during the first 60 minutes (the "IB")
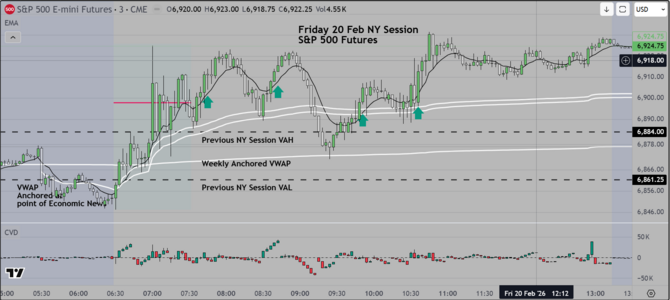
At these critical time periods, all the big institutions are communicating to each other (by using Limit Orders placed strategically)
Retail traders can "see" this for themselves, by watching for places where the market "Stalls" and move sideways for short periods of
time, them continues (usually higher). Again referring to previous charts, go to a place where the market stalls and goes sideways
after a short rally. Count the 5 minute bars and then look for resumption of the previous move. How hard is that? I realize there is
more to it, but that is a good start for retail traders who want to understand more about how the game is being played.
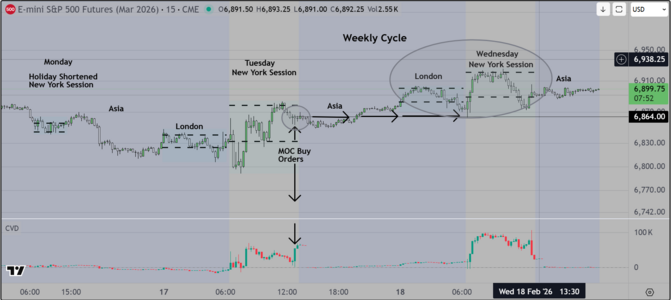
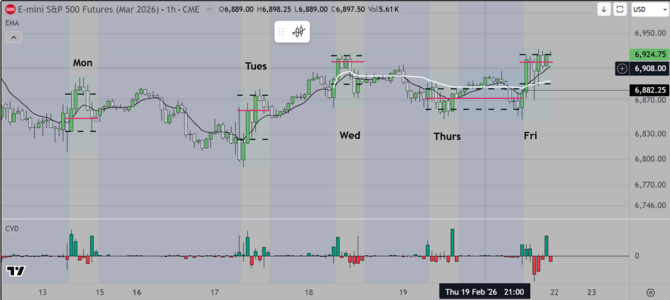
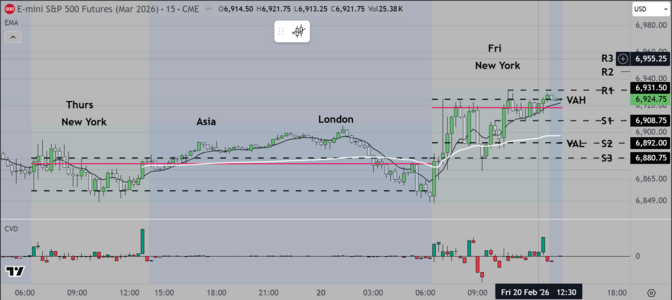
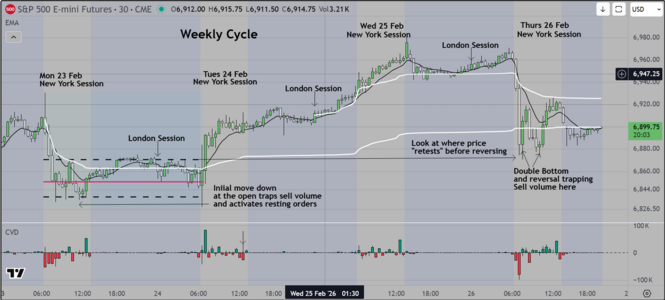
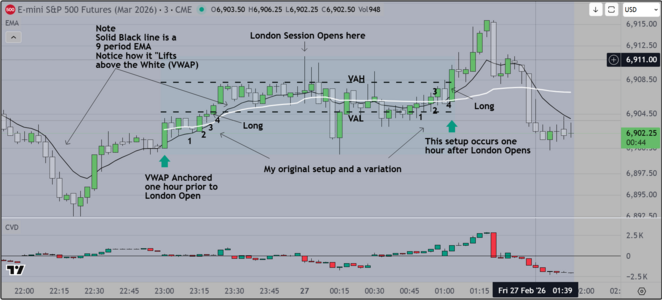
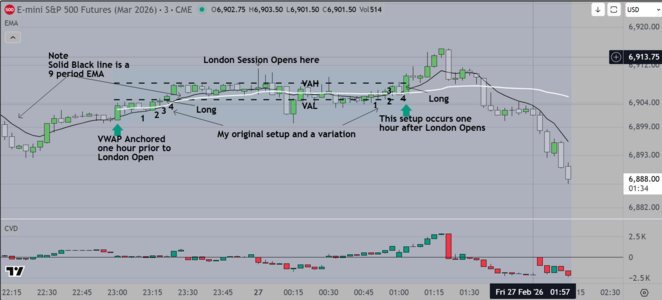
On the longer time frame (Weekly chart above) you can see the same thing using 30 minute candles. On this time frame you see the market
close out, then as London opens, they either "sweep" down before stranding sellers OR they test a specific low (by time) and then reverse.
Check the Weekly Markup chart. What I am talking about (the "sweep" is about activating resting orders at or below an area where inventory
is staged, then when they decide its time to move, they put money to work. Once you see a wide range directional candle in the other direction
you should be able to see the direction of the market change
Good Luck