A Professional Approach to Trading Futures

Here is the weekly cycle showing price action on chart with 30 minute candles on the right
and 15 minute candles on the left

Reset Wednesday is our primary reference, because (as it showed last week), institutions decided
to make adjustments on that day, and the effects rippled though the markets on Thurs and Today (Friday)

Using the lows (Thurs & Friday) allowed me to make good trades both days

Good luck
 

Attachments

  • Week of Jan 23.PNG
    Week of Jan 23.PNG
    178.2 KB · Views: 24
For those unfamiliar with an institutional approach we have updated the previous chart
hoping to make it easier for retail traders to understand

The chart on the left shows an example of the "Overnight Drift" as researched by the NY Fed
Interesting that this isn't of more interest. Not one person here has inquired about it and yet
it is most reliable way to make money bar none (google it).

Good luck
 

Attachments

  • Monday Framwork.PNG
    Monday Framwork.PNG
    145.7 KB · Views: 15
Last edited:
Hello London & Euro Traders

Here are the pending High Impact Economic Reports for the week
-------------------

NY Session Outlook – S&P 500 E-mini Futures​

This document provides a professional institutional-style outlook for the upcoming NY Session, combining high-impact macroeconomic releases with an intraday regime and scenario analysis based on the provided S&P 500 E-mini Futures chart.

1. High-Impact Economic Releases​

Monday:
- ISM Manufacturing PMI (10:00 am EST) – High impact

Tuesday:
- JOLTS Job Openings (10:00 am EST) – Medium impact

Wednesday:
- ADP Employment Change (8:15 am EST) – Medium impact
- ISM Services PMI (10:00 am EST) – Medium/High impact

Thursday:
- Bank of England Rate Decision (7:00 am EST) – Global risk impact

Friday:
- U.S. Employment Situation Report (8:30 am EST) – Highest weekly impact

And our Scenarios

NY Session Scenarios

Scenario A – Bearish Continuation (Primary):
- Failure to reclaim prior session value
- Rejection at VWAP or London session resistance
- Acceptance below prior NY lows

Scenario B – Mean Reversion / Short Covering:
- Oversold open with inability to continue lower
- Responsive buying into early NY
- Rotation toward VWAP before sellers re-engage

Scenario C – News-Driven Reversal:
- Strong labor or macro surprise
- Sharp impulse move followed by pullback
- Structure flip confirmed by higher low above VWAP

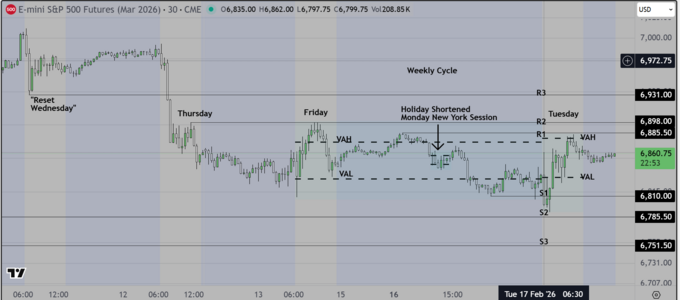
Regime Identification

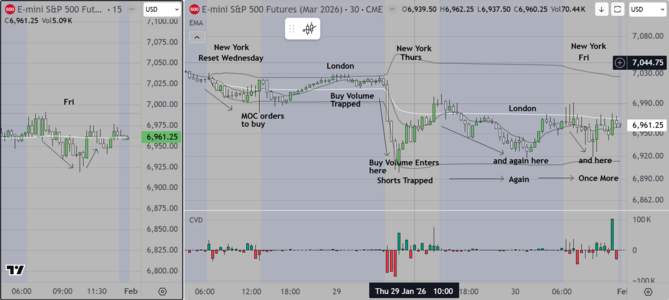
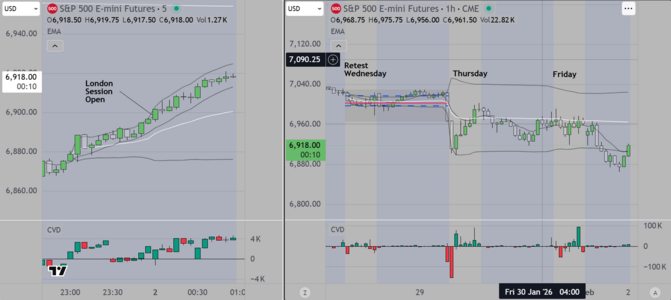
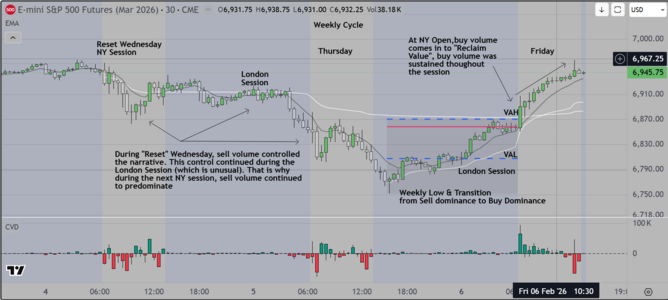
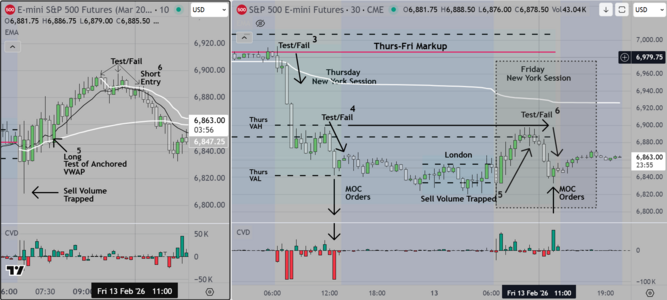
The 1-hour ES chart reflects a transition from an upside rotational environment earlier in the week to a late-week downside regime. Early week sessions showed controlled higher highs with acceptance, particularly during London and early NY trade. However, Thursday marked a clear regime shift as price failed to sustain prior highs and initiated directional selling.

Friday follow-through selling confirmed distribution and a bearish intraday bias. The structure now shows lower highs, weaker acceptance above VWAP, and downside continuation into the close.

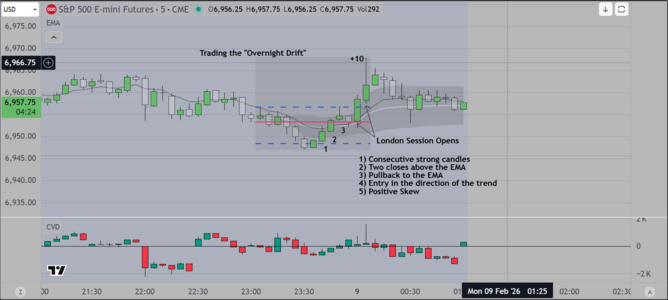
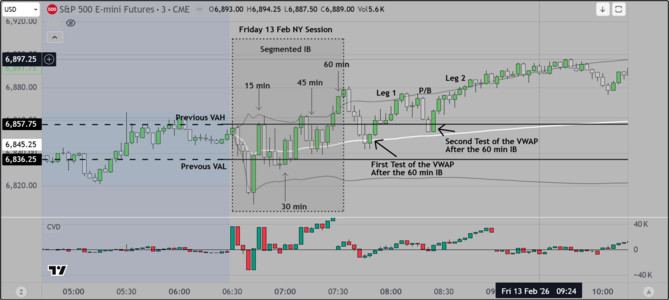
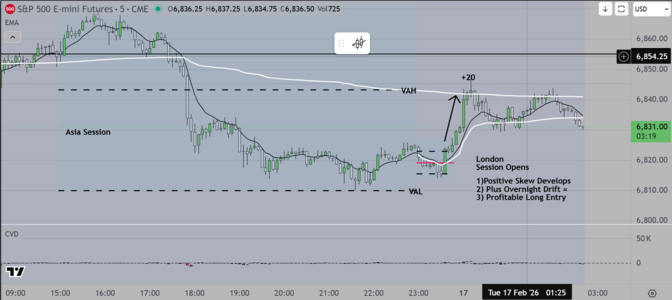
For this type of day, we would monitor only for 30 minutes, waiting for the early discovery process
to unfold. We would enter a position based on clean break to either side, although we favor downside
continuation early.
 
The London Session is fast drawing to a close. We stayed up to trade
what is for us, an "Overnight Drift" condition. Although the setup was not
perfect, it was close enough that we were willing to accept risk in order to
obtain a windfall return. In this case it was +30 pts

Regarding the New York session which starts in about an hour, we will stay up
long enough to monitor price action and if we see a reasonable entry at the
close of the IB, we may give it a go on smaller size.

Good luck
 

Attachments

  • Overnight Drift Setup 1.PNG
    Overnight Drift Setup 1.PNG
    108.4 KB · Views: 14
Hello Traders

Posting this chart showing the result so far
The day was interesting in that it was different than expected
The preferred scenario (Rotation lower) did not play out. Readers who
followed my previous post saw the "Overnight Drift" THEN if you look at the chart
you can see that price "reclaimed" territory (Previous New York Session low first,
then (at the New York Open) again it "reclaimed" the previous session Value Areas Low
and High. It is no coincidence that at 6pm, when the report was released, price was AT
this area (that is what institutions wanted) and algos were activated to move the market higher
and defend both the VWAP (buyers were willing to buy above that price) and the 9 period ema
When it is this obvious, professionals do one thing and one thing only (buy on shallow pullbacks).
Easy day for skilled traders
 

Attachments

  • End of Day Chart 2-2-2026.PNG
    End of Day Chart 2-2-2026.PNG
    152.6 KB · Views: 12
Hello Traders

Here on the West Coast USA, it is Friday night, and we have had another "gift" session
in that it followed a cyclical pattern that we have seen so many times in the past.

For those unfamiliar with the Weekly Cycle, We divide the week into a front half (Monday through Wednesday)
and a back half (Wednesday through Friday). We treat Wednesday as a transitional day, where control of the market
can and often does reverse. On this chart we show sellers in control until price reaches an area that institutions define
as "trading at a discount to fair value". At that point, buy volume enters to capture that value, mark it up, and distribute
at a premium, and it is no surprise (to us) that this occurs on a Friday. What IS remarkable is that we never hear retail traders
making use of this concept. Once you understand it, it allows you to know whether to hold, or take scalp profits during a
particular session. Looking at all the other strange approaches to trading, it becomes obvious that most retail traders don't know
when to hold and when to get out. The bottom line is that you trade too much and even it you are pretty good, you end up
giving it all back (and more).

Good luck
 

Attachments

  • Weekly Cycle Feb.PNG
    Weekly Cycle Feb.PNG
    164.2 KB · Views: 5
For those who MAY wish to learn more, please note the following.
I teach math, I know statistics and quantitative methods and yet
I only use a small fragment of that knowledge to trade. Why? Because
what is most useful to a trader is 1) basic ability to think critically (also known
as "common sense"), 2) The ability to control your emotions, meaning that you
can watch while the market opens, knowing that you might miss a move, but
confidence that later in the session, there will be opportunities to make money.
3) Discipline necessary to wait for the right time to enter (and exit). Obtaining
these skills is the real difference between a retail trader who gets chopped up
or gives everything back by overtrading, and a skilled professional who can
identify the right conditions (when to wait and when to act). My mentor explained to me
that trading is like working a puzzle and you have set a timer. You have a certain time
in which to figure out where the pieces fit together. Once that timer goes off, its
simple accounting, you either win or lose.
 

Attachments

  • Use of Statistical Tools.PNG
    Use of Statistical Tools.PNG
    220.1 KB · Views: 5
For those who did not choose to engage AND for those who did but did not stay in touch
I want to post this important example of what institutions call "context" before I stop posting
on this website.

My mentor taught that "Context is Everything", meaning that a trader must 1) understand and then be
able to 2) identify the specific data that are important to institutions, because ultimately THEY decide whether
to move markets higher or lower, as well as 3) at what price & time.

This example shows something that most of your have no clue about. Institutions divide the market into
time periods, each period contains an "initial balance" during which they decide whether the current price is
"fair", followed by a period of inventory positioning (what retail traders mistakenly call a "setup"), followed
by a directional move higher or lower OR if the market is anticipating economic news, a trading range (sideways)

Good luck
 

Attachments

  • Institutional Context Example.PNG
    Institutional Context Example.PNG
    114.5 KB · Views: 3
Last edited:
Back
Top