Warren's Futures Trading

Alright, let's please drop the commission discussion, and focus on trading ... :D

I revised the stop on JYM10 to 11026, based on overnight price action, so order is now to exit long position at 11207 with stop at 11026.

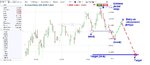
SFM10 broke the alert level last night, and I'm trying to get short on a retracement rally:
Sell 2 SFM10 @ 9482. If filled, exit @ 9420, stop @ 9526.
Margin $5,400, risk $1,100, reward $1,550.

ECM10 is close to the alert level, and will probably break it when SFM10 gets to the downside target. I'll be looking to go short on a retracement rally there too.

Incidentally, I'm still bullish on the stock indices, and am holding a long position. Not reporting it here yet, as I haven't gotten a short term signal. However, since June 2009, my upside target has been 1220.91 on the cash SP500. This was based entirely on my basic methodology. Looks like we're going to get there in the not too distant future.
 

Attachments

  • Warren's Futures Trading.xls
    21 KB · Views: 292
Got close to my short entry on SFM10, but didn't quite make it. 9477 reaction high vs my sell at 9482. Looks like I'll probably miss this one.

To further elaborate on my methodology, I'll post a ECM10 4 hour chart, notated with my analysis. As you can see, I identify 5 points, ABCDE.

A is the alert level, the key reversal indicator, and the measuring point.
B is the extreme (high or low), and the initial stop is 1 tick beyond.
C is the extreme of the break beyond the alert level
D is the entry price, and is 1 tick before the 50% retracement of BC
E is the exit price, and is 1 tick before the target (2A-B). This is Newton's 2nd law of motion, that every action has an equal and opposite reaction. I'm measuring the move from A to B, then projecting the opposite move from A to E. Once E is reached, I'm done with the trade, and moving on to the next opportunity.
 

Attachments

  • ECM10.JPG
    ECM10.JPG
    78.3 KB · Views: 208
Last edited:
Got close to my short entry on SFM10, but didn't quite make it. 9477 reaction high vs my sell at 9482. Looks like I'll probably miss this one.

To further elaborate on my methodology, I'll post a ECM10 4 hour chart, notated with my analysis. As you can see, I identify 5 points, ABCDE.

A is the alert level, the key reversal indicator, and the measuring point.
B is the extreme (high or low), and the initial stop is 1 tick beyond.
C is the extreme of the break beyond the alert level
D is the entry price, and is 1 tick before the 50% retracement of BC
E is the exit price, and is 1 tick before the target (2A-B). This is Newton's 2nd law of motion, that every action has an equal and opposite reaction. I'm measuring the move from A to B, then projecting the opposite move from A to E. Once E is reached, I'm done with the trade, and moving on to the next opportunity.

As in Euro example,

i) does B have to be higher than the high preceeding A, and
ii) C has to be lower than A?
 
As in Euro example,

i) does B have to be higher than the high preceding A, and
ii) C has to be lower than A?

i) If A is a low (as in the example), then B has to be higher than the high preceding A. If A is a high, then B has to be lower than the high preceding A.

ii) If A is a low, then by definition, C must be lower than A, otherwise there is no break below A. If A is a high, then by definition, C must be higher than A, otherwise there is no break above A. Bottom line, is that there is no signal unless A is broken.

thanks for your reply. Newton law says the reaction is equal to the action. Your target in forumula (2xA) -B is twice the difference between A & B. why not (B-A)? Is it for better R:R?
 
thanks for your reply. Newton law says the reaction is equal to the action. Your target in forumula (2xA) -B is twice the difference between A & B. why not (B-A)? Is it for better R:R?

We're saying the same thing. 2A-B gives you the target point E, where A to B equals A to E. So the action does equal the reaction. Just do the math, and you'll see it's the same thing.
 
i) If A is a low (as in the example), then B has to be higher than the high preceding A. If A is a high, then B has to be lower than the high preceding A.

ii) If A is a low, then by definition, C must be lower than A, otherwise there is no break below A. If A is a high, then by definition, C must be higher than A, otherwise there is no break above A. Bottom line, is that there is no signal unless A is broken.

I hope you don't mind me jumping in, but I think most of the readers will understand your setup in the following terms (if I have understood it correctly):

"after a Higher Low (A), we go on to set a Higher High (B). If we then go on to set a LOWER LOW (C), we look for an entry at the 50% retracement from Higher High (B) to Lower Low (C)".

HL-> HH-> LL-> 50% for shorts
LH->LL-> HH-> 50% for longs

Sorry to interrupt, good thread so far.
 
Back to trading:

Stopped out of JYM10 @ 11025 for a loss of $525 (plus comm.).
SFM10 got to my 9420 target, so the original order to sell @ 9482 was canceled.

TYM10, JYM10, SFM10 and ECM10 all signaled to enter short trades on the 4 hour charts, however SFM10 and ECM10 both indicate long on the daily charts.

I try to avoid trading when the 4 hour and the daily conflict, as they do here. What I've found however, is that the 4 hour chart will usually give me the retracement (C-D) on the daily chart. That's not the case here in SFM10 and ECM10, so I'll pass on them. The previous SFM10 short that I missed was in sync with the daily chart long position.

Similarly, I try to avoid trading when the daily and the weekly conflict, which is the case with SIK10.

Long ago, I used to trade full time, and then I would also use the 1 hour and 15 minute charts. I gave that up years ago, as I became quite obsessive. The rules apply there as well though, and I would avoid trading a market when the signals from the various charts were not in sync.

I was filled on short JYM10, and am waiting on a retracement rally to enter TYM10.

Capital at $19,461.

New orders:
Sell 3 TYM10 @ 117-8.5. If filled, exit @ 116-28, stop @ 117-18.
Margin $4,455, risk $890.63, reward $1171.88.

Sold 1 JYM10 @ 11082. Exit @ 10907, stop @ 11149.
Margin $3,780, risk $837.50, reward $2,187.50.

All open orders, trades, and analysis in the attached spreadsheet.
 

Attachments

  • Warren's Futures Trading.xls
    32 KB · Views: 365
I hope you don't mind me jumping in, but I think most of the readers will understand your setup in the following terms (if I have understood it correctly):

"after a Higher Low (A), we go on to set a Higher High (B). If we then go on to set a LOWER LOW (C), we look for an entry at the 50% retracement from Higher High (B) to Lower Low (C)".

HL-> HH-> LL-> 50% for shorts
LH->LL-> HH-> 50% for longs

Sorry to interrupt, good thread so far.

Yes, that's exactly right. Mathematically, 2*A-B gives the target, and (B+C)/2 gives the 50% retracement. I enter tick before the 50% retracement, and exit 1 tick before the target.
 
We're saying the same thing. 2A-B gives you the target point E, where A to B equals A to E. So the action does equal the reaction. Just do the math, and you'll see it's the same thing.

you're right.. but what I meant was the distance from D to E (expected profitable move) would be greater than that of A to E, as D is bound to be higher than A for shorts and lower than A for long.
 
Been a busy day at work, and I haven't had time post. I updated my analysis / order spreadsheet, and am posting below.

Still short JYM10, canceled my order on TYM10 as it got to the target without me. New long position in YGM10, and short positions in SFM10 and YIK10. Sell orders in on E7M10 and NQM10.

Details as follows:

YGM10: Long 1 @ 1116.9. Exit @ 1142.7, stop @ 1098.5.
Risk $611, reward $857.

SFM10: Short 1 @ 9461. Exit @ 9284, stop @ 9526.
Risk $813, reward $2,213.

YIK10: Short 1 @ 17.245. Exit @ 16.09, stop @ 17.67.
Risk $425, reward $1,155.

E7M10: Sell 1 @ 13660. If filled, exit @ 14360, stop @ 13820.
Risk $1,000, reward $1,250.

NQM10: Sell 2 @ 1935.25. If filled, exit @ 1909.50, stop @ 1948.50.
Risk $530, reward $1,030.
 

Attachments

  • Warren's Futures Trading.xls
    32 KB · Views: 238
Haven't posted in a few days, but am ready to get back to it. My wife is 14 weeks pregnant (2nd child), and we just had a miscarriage scare / false alarm, but everything is fine now.

Between work and personal time constraints, I've decided to cease the intraday trading from the 4 hour charts, and will only focus on the daily charts, which in fact have always served me better. I added some money to get my account back to my initial level of $20K, accounting for a couple of profits and losses that were in place. I've updated my trading analysis / tracking spreadsheet to reflect this too.

Current positions are:
1) Short 2 YIK10 (mini silver)@ 17.245. Target exit @ 16.09, stop @ 17.67.
Margin $4,860, risk $850, reward $2,310.
2) Short 1 ADM10 @ 9082. Target exit @ 8845, stop @ 9165.
Margin $2,430, risk $830, reward $2,370.

Open orders:
1) Sell 1 JYM10 @ 11075. If filled, target exit @ 10371, stop @ 11149.
Margin $3,780, risk $925, reward $8,800.
2) Sell 1 YGM10 (mini gold) @ 1117.6. If filled, target exit @ 1033.5, stop @ 1135.1.
Margin $1,800, risk $581, reward $2,792.
3) Sell 5 M6BM10 (micro GBP) @ 15110. If filled, target exit @ 14568, stop @ 15376.
Margin $2,025, risk $831.25, reward $1,694.

I would like to short USM10, but the risk to stop is too high at present. Target is down to 113-10.

Total capital = $19,346.
Total risk = $4,017.
Total reward = $17,966.
 

Attachments

  • Warren's Futures Trading.xls
    31 KB · Views: 248
Update for today, with revised orders based on today's closing prices.

Current positions unchanged from earlier this afternoon:
1) Short 2 YIK10 (mini silver)@ 17.245. Target exit @ 16.09, stop @ 17.67.
Margin $4,860, risk $850, reward $2,310.
2) Short 1 ADM10 @ 9082. Target exit @ 8845, stop @ 9165.
Margin $2,430, risk $830, reward $2,370.

Open orders:
1) Sell 1 J7M10 (mini Yen) @ 11055. If filled, target exit @ 10371, stop @ 11149.
Margin $1,890, risk $588, reward $4,275.
2) Sell 1 YGM10 (mini gold) @ 1116.3. If filled, target exit @ 1033.5, stop @ 1135.1.
Margin $1,800, risk $624, reward $2,749.
3) Sell 5 M6BM10 (micro GBP) @ 15082. If filled, target exit @ 14568, stop @ 15376.
Margin $2,025, risk $919, reward $1,606.
4) Sell 1 TYM10 @ 116-15.5. If filled, target exit @ 113-7, stop @ 117-15.5.
Margin $1,485, risk $1000, reward $3,266.

Total capital = $19,346.
Open profit (loss) = +1060 in YIK10, +760 in ADM10 = +$1,820.
Total risk = $4,810.
Total reward = $16,576.
 

Attachments

  • Warren's Futures Trading.xls
    31.5 KB · Views: 230
Nothing new to report today. My short ADM10 position moved favorably, and my short YIK10 position moved against me. No changes to my orders, as no alert or stop levels were hit.

Over the years, I have collected many books on trading, and have 129 in ebook format. I've posted a spreadsheet with a listing, sorted by Author, Title, and Subject. Please email me if you are interested. I'm not looking to make money on this, just to partially defray my purchase costs.
 

Attachments

  • Trading Ebooks.xlsx
    27.3 KB · Views: 1,173
Top