A Professional Approach to Trading Futures

and here is our last markup for today

We will provide one (1) example showing just how important the statistical
skew is to Professionals. We monitor the relationship between the White (AVWAP) line
and the Red (POC) line. Notice how the White AVWAP) crosses above the POC just prior
to the NY Open. We call this a "Tell", because it foretells the move up off the open. This is
a high probability long entry good for almost 10 pts if executed properly.

And at the bottom pane, we use the CVD later in the session to identify "Leg 1-Pullback-Leg 2" which
is also a classic, high probability long based on the concept that shorts are trapped below and have
to "give up". Once those stop loss orders are activated, the only choices they have are 1) to stand aside
and miss the rest of the move up, OR 2) to "chase the market", entering late. Usually they do just that, and the
momentum they create is the fuel needed to move the market higher to test 7,000+

Good luck
 

Attachments

  • 7 Jan 2nd Markup.PNG
    7 Jan 2nd Markup.PNG
    125.6 KB · Views: 48
Last edited:
Hello London & EuroZone Traders
It is 7:20am in Sunny California

In another thread I have mentioned that I have started to write
a series of articles, about my experience with Funded Trader "Challenges"
I have concerns (I guess you might call them "critiques"). In my opinion
it is problematic, that this industry makes most of its money based on
the inability of customers to trade profitably. Some of the participants to
their credit, have begun to offer education, but they are in the minority.
Also, in my research I find that most of them rely on AI agents to respond
to inquiries and provide customer support. I personally don't like this trend
because the AI agents are crap. (Just one man's opinion). Finally, there are
reports of inconsistent or suspicious business practices as regards payouts and
application of rules. In my opinion, it is a matter of time before regulatory agencies
step in the enforce standardization across the industry. It is much needed. As the
basis for my articles, I am using OneUp Trader, and will report my experiences as
they unfold. So far, OneUp has done a good job, especially as regards support
and I like them. Early days. Updates to follow

As regards my course of study, I have finished it and will start to teach a class specifically for
retail traders (if sufficient demand exists). I have enjoyed writing the scripts, because it
required that I look closely at my own training, and confirm that my education is still relevant
and that in the aggregate, my advantage remains stable. For my private account I trade
two (2) systems, one is a short time frame (intraday) approach using mean reversion, and
the other is trend following over various time horizons. To date both are ITM

Good luck
 
Hello London & EuroZone Traders

For those who have been waiting, you are running out of time
I am going to start a class pretty soon and once it is filled that's it

Attaching a couple of charts to show the Basic System
which is what I recommend that all Retail Traders learn. The basic
premise is as follows

1) Learning to identify regimes (Market states) is critical to success
2) Once you know the "State" of the Market (Balanced, Imbalanced) you
can choose that approach that provide the best chance of success
3) When you match the conditions to the system approach all that is left
is execution (Trade Entry, Risk Management, Record Keeping).

Most Retail Traders fail to do at least one of the three critical elements of Professional
trading. These are "Fatal" errors. For example, you have to have a system setup
so that you enter your order to buy or sell, and the stop loss is automated. By "Automated"
we mean that the order is held on the broker/exchange side, so that in the event of a
problem (power outage, earthquake, fire, flood, whatever), you are taken out with a minimum
loss. Most retail traders never consider this, and go on with their lives, until the one time it
happens and blows up their account.

So today we post the following charts
1) First chart shows the context (previous session) and note the MOC order at the end of the session
57,000 contracts to go (to sell). According to the NY Fed research, this suggests that the "Overnight
Drift" is a possibility and traders could make money trading the London Session. The question is can
you identify the correct regime in which this "Drift" higher is likely to occur?
2) If instead you choose to trade the next NY session, can you identify THAT market regime? and know
when to stand aside (while the "Skew" develops?
3) Finally, if you do decide to trade the NY session, can you identify WHEN the skew develops sufficiently
to identify a high probability entry? The outline of the process makes it seem simple, but its the preparation
to trade that separates Professionals from the Retail.

Check out the charts, and ask yourself if you could identify the conditions on your own. Most retail traders
cannot accurately identify market regimes, AND most do not even know what statistical skew is. let alone identify it.

I think I've said enough and now I rely on the intelligence of those who may read it.


Good luck
 

Attachments

  • Regime Identification.PNG
    Regime Identification.PNG
    101.1 KB · Views: 19
  • Developing Skew 1.PNG
    Developing Skew 1.PNG
    108.5 KB · Views: 18
  • Step 2 & 3.PNG
    Step 2 & 3.PNG
    118.6 KB · Views: 20
Last edited:
Early Good Morning London & EuroZone Traders
It is 3:13am in London and in California it is 7:13pm

This will be a short summary of our standard preparation process.
Typically on a Saturday or Sunday (about mid-day) we take time to
list the high impact economic reports scheduled for release during the
next week. We plan our strategies based on the expected (consensus
or "Whisper") numbers, and we make decisions as to whether to trade
Asia, London, or just the NY Session of the S&P 500 Futures Market. We
also look at the context, which for us is previous price action, as well as
any MOC imbalance that might affect the London Open. Here is the
condensed version
-------------
Scheduled High-Impact Releases Prior to the London Open
  • U.S. CPI on Tue, Jan 13 is typically the biggest market mover of the week, and its release time (~13:30 GMT) overlaps the London session and drives volatility in S&P 500 futures.
  • Japan trade and current account figures can influence Asia risk sentiment and carry into early European ordering flows.
  • Treasury auctions and Fed speaker events on Monday (Jan 12), while not classic “economic data,” are also watched by institutional traders for indications of yield and liquidity conditions ahead of the London session.
CPI Consensus Expectations (as of current surveys)

Based on the latest available economist forecasts and weekly calendar data:

Consensus forecasts for the Jan 13, 2026 CPI release are roughly:
  • Headline Consumer Price Index (YoY): ~2.7% (vs prior)
  • Core CPI (YoY): ~2.7%
  • Month-over-month readings: typically expected in the ~0.3% range for both headline and core inflation.

These figures imply that inflation is expected to remain in the “upper 2% range” — a zone that historically is viewed neither strongly inflationary nor deflationary, but still crucial for monetary policy expectations.
-----------------------------------------

How Far Ahead Institutions Position for CPI

Many hedge funds and prop desks start adjusting positioning well before CPI Tuesday morning — sometimes as early as the prior Friday or Monday session — to reduce the risk of being caught on the wrong side of a surprise. This positioning behavior is a key reason why markets often move into CPI before it’s released.

Even if consensus suggests modest inflation, the market reaction scope is wide because:
  • A higher-than-expected CPI could push back expectations for Fed rate cuts and steepen yield curves — often negative for equities.
  • A lower-than-expected CPI can reinforce a more dovish Fed outlook and steepen the yield curve — often positive for equities.
  • Volatility skew, hedging costs, and positioning flows mean the magnitude of reaction can exceed the direction alone.

Institutions trade positioning flows and expectation dynamics just as much as the print itself.

We will NOT provide trading scenarios this evening. We suggest traders try to figure it out themselves and see how you do.

We will provide what professionals call the "Asia Skew" on a chart with 5 minute candles
Current time in London is 4am

Good luck
 

Attachments

  • Asia Skew.PNG
    Asia Skew.PNG
    79.8 KB · Views: 19
Here is an interesting markup chart for London & EuroZone Traders

The chart uses 15 minutes candles and is instructive IF you want to trade the London
Session, AND you know how to capitalize on the "Overnight Drift". IF you don't know
what the Overnight Drift is, then you (like most retail traders) are at a disadvantage
because you are competing with Professionals who DO know about it, and are making
money on a regular basis trading it. It's that simple.

As you view the chart, notice the far left side (Friday NY Session) where institutions drive
price down to a low, and then buyers come it, to trap sell volume (to trap sellers).
During Asia session, it happens again, as institutions drive price down to RETEST the lows
and look what happens (again) this time during the London Session Open, and right before
high impact economic news is released (what a coincidence) buyers come in again, trapping
sell volume near the previous lows. The rest of the session was traders buying for any reason
Sellers had no chance to make money
 

Attachments

  • Trapped Volume Example 6.PNG
    Trapped Volume Example 6.PNG
    111.1 KB · Views: 13
Posting a list of the High Impact Economic Reports scheduled for release
tomorrow.
-------------------------------
  1. U.S. Consumer Price Index (CPI) – December 2025
    • Headline CPI & Core CPI (month-over-month and year-over-year) — major inflation indicator that heavily influences interest rate expectations, USD valuation, and equity market direction.
    • Scheduled for 08:30 AM ET (which is 13:30 London time / 08:30 New York) — after the London session.
    • This is widely considered a high-impact release.
  2. U.S. Real Average Earnings – December 2025
    • Released at the same time as CPI — provides insight into consumer purchasing power after inflation. While slightly less followed than headline CPI, it is still considered important.
🧠 Market Impact Notes
  • The CPI release on January 13 is the first comprehensive inflation print following distortions due to the U.S. government shutdown and thus garners extra attention from traders, policymakers, and analysts regarding inflation trends and Fed policy expectations.
  • There are no other major U.S. or European high-impact macroeconomic releases scheduled later on January 13 that traditionally carry similar market impact (e.g., retail sales or industrial production) — though other data may come on subsequent days of the week.
 

Attachments

  • 2 Day Markup Jan 12.PNG
    2 Day Markup Jan 12.PNG
    122 KB · Views: 13
Posting a list of the High Impact Economic Reports scheduled for release
tomorrow.
-------------------------------
  1. U.S. Consumer Price Index (CPI) – December 2025
    • Headline CPI & Core CPI (month-over-month and year-over-year) — major inflation indicator that heavily influences interest rate expectations, USD valuation, and equity market direction.
    • Scheduled for 08:30 AM ET (which is 13:30 London time / 08:30 New York) — after the London session.
    • This is widely considered a high-impact release.
  2. U.S. Real Average Earnings – December 2025
    • Released at the same time as CPI — provides insight into consumer purchasing power after inflation. While slightly less followed than headline CPI, it is still considered important.
🧠 Market Impact Notes
  • The CPI release on January 13 is the first comprehensive inflation print following distortions due to the U.S. government shutdown and thus garners extra attention from traders, policymakers, and analysts regarding inflation trends and Fed policy expectations.
  • There are no other major U.S. or European high-impact macroeconomic releases scheduled later on January 13 that traditionally carry similar market impact (e.g., retail sales or industrial production) — though other data may come on subsequent days of the week.

We believe that the market will test higher, trapping buyers and then reverse. Why? Because that is what was
done previously. Option 2 is a clean break followed by a retest, and then price resumes the break. This could happen
in either direction.
 
Good Early Morning London & EuroZone Traders
It is almost 5am in The City

We start by offering a list of high impact economic events
that will affect London, during what professionals call the
"Primary Risk Window" (NY session of the S&P 500 Futures).
-------------------
U.S. Pre-Market (Primary Risk Window)
8:30 AM ET

  • Producer Price Index (PPI)
    • Confirmation or contradiction of CPI trend
    • Impacts rates first, then equities
  • Advance Retail Sales
    • Demand-side data
    • Strong prints post-CPI can reignite growth vs inflation trade-offs
-------------------------------------------
Trader Focus:

Does PPI/Retail Sales validate CPI, or introduce doubt?
This determines trend continuation vs mean reversion at the open

--------------------------------------------
Trading Scenarios (After the CPI)

1) Continuation Day (Resumption of Previous Trend)
  • Overnight Globex holds above/below CPI value area
  • NY open sees shallow pullbacks
  • Trend resumes by late morning
Trader Implication:
Bias stays aligned with CPI direction. Fade attempts usually fail unless PPI contradicts.

2) Balance Day (trading range)
  • Asia and Europe trade sideways
  • NY session opens into range expansion without follow-through
  • Mean reversion dominates
Trader Implication:
Expect responsive trading, not initiative. Value area edges and VWAP matter more than trend.

3) Reversal Day
  • Overnight holds direction, but NY cash fades the move
  • Reversal often starts between 10:00–11:30 AM ET
Trader Implication:
Watch for failed continuation, and poor acceptance beyond CPI high/low
-------------------------------------

Key Institutional Takeaways

1) CPI creates a reference framework using the following
  • Value area created after the CPI Release
2) Tomorrow’s NY session is less about new information and more about whether:
  • PPI/Retail Sales confirm CPI, or
  • The market decides CPI was fully priced
So the question is "When can a skilled trader know whether CPI was "Fully Priced"

NY Cash Open (9:30–10:00 ET)


This is the confirmation phase.

Fully priced by this point if:
  • Cash open fails to extend Globex range
  • Opening drive is faded within first 30 minutes
  • ES trades like a balanced market
Not fully priced if:
  • Opening drive holds
Late Morning (10:30–11:30 ET)

If CPI were not fully priced:
  • Trend reasserts after early pullbacks
  • No meaningful responsive buying/selling against direction
If CPI was fully priced:
  • Clear intraday reversal
  • Failed breakout / breakdown
  • Strong mean reversion back to VWAP or value
RULE OF THUMB

If CPI hasn’t gained new acceptance by the cash open, it’s probably priced.
If it can’t reassert direction by late morning, it definitely is.

That’s why tomorrow’s NY session matters:
  • It answers whether yesterday’s CPI move was information-driven or positioning-driven.
  • Experienced traders know within 30–90 minutes
  • Confirmation comes by the NY open
  • Final verdict by late morning
PostScript

We attach a chart, showing the previous NY session, and prior to the start of that session
you can see the wide range bar created by the release of the CPI. You can also see the Value Area
that was created during that session. As time moves on, we see Asia, and the start of London
and the Value Areas created during those sessions. For institutional and Commercial Professionals
much of the decision making process is about how price acts relative to (Fair) Value. Thus the use
of words like "Reclaim, initiative, Responsive, Rejection, Balance, Repricing, etc".

Good Luck
 

Attachments

  • NY to London Jan 14.PNG
    NY to London Jan 14.PNG
    78.5 KB · Views: 13
Last edited:
I want to thank President Trump for creating this very
obvious profit opportunity, as risk is repriced to the downside

Attaching a chart that shows the initial move down, followed by
a short period of two way trading, and then (at the retest shown on the chart.
an easy failure entry

I will stand aside until the next timed window which is at about 9am/5pm London

Good luck
 

Attachments

  • Failure to Downside Reprice.PNG
    Failure to Downside Reprice.PNG
    119.7 KB · Views: 11
Last edited:
From my point of view the best path forward is to monitor only
manage risk and wait.

As mentioned previously, the markets responded to the US President's
comments, trying to pressure the Fed Chairman, negatively (as they should)
clearly an independent Federal Reserve is necessary.
 

Attachments

  • Trend Day Down 14th Jan.PNG
    Trend Day Down 14th Jan.PNG
    117.7 KB · Views: 14
Hello London & EuroZone Traders

We list the high impact Economic Reports scheduled for release prior to the
Open of the New York Session of the S&P 500 Futures, which is defined as
the Primary Risk Window for this 24 hour period.
--------------------------------------
  • Initial Jobless Claims: The consensus forecast expects claims to remain stable near 210,000. A spike would suggest a cooling labor market and could impact the S&P 500 futures.
  • NY Empire State Manufacturing Index (January): The consensus is for a rebound to 9.5, from a previous reading of -3.9. This is the first regional manufacturing read of the year.
  • Philadelphia Fed Manufacturing Index (January): The consensus forecast is for a positive reading of 2.5, up from the prior month's -10.2. A positive figure would suggest the regional manufacturing sector is emerging from a slump.
  • U.S. Import and Export Price Indexes: Market participants will also receive data on import and export prices, though consensus figures for these specific metrics were not a primary focus in the provided analysis.
----------------------------------------
Key Insights
These reports, particularly the labor market and manufacturing data, are critical as they provide real-time information on the health of the U.S. economy and can influence Federal Reserve interest rate expectations.

-----------------------------------------

High Impact Earnings Reports

Morgan Stanley (MS) and Goldman Sachs (GS) will report fourth-quarter earnings, which may generate significant volatility in the afternoon.
From a professional standpoint, we will want to know what the consensus is, when the report is scheduled for release, and once the release
occurs, whether the content indicates alignment or departure (surprise) as regards expectation. If we observe a WRB at or after the release
it would trigger a specific strategy known as "Rule of 4", in which we trade based on the response at a specific time AFTER the release.
-----------------------------------------
General Comment

Instead of offering Scenarios, as we have done previously, we will provide this summary and ask traders to create their own scenarios
Can you do this on your own, and on what basis. As we have said previously, we make decisions based on price action, specifically whether
price acts to stay inside prior value, or executes what professionals call a "clean break" above or below previous value. We ask the following
questions

1) Does price break clean and retest (preferred), and then resume, does price fail (trapping traders who "bought" the breakout).
(Professionals expect most (about 70%) of breakouts to either pullback or fail within five (5) bars).
2) Do we have a reasonable profit target above or below
3) Do we have a reasonable stoploss, if the logic for our entry is no longer valid.

In the current environment, with the consensus expecting a rebound to positive territory for both indices, a significant miss on the downside would likely prompt a negative market reaction as it would signal a potential recessionary risk, while meeting or exceeding the forecast would likely be a positive tailwind for stocks.

Good Luck
 

Attachments

  • 2 Day Markup Jan 14.PNG
    2 Day Markup Jan 14.PNG
    90.7 KB · Views: 11
Hello London & EuroZone Traders
It is 11:20am in The City

In our previous post, we proposed the possibility of a breakout (either direction)
and how that might be traded.

On the chart attached below, we show the open of the London S&P 500 Session
and by coincidence, that breakout did transpire. On the attached chart, we mark it
using an ellipse, describing it as follows.

1) Break to the upside occurs prior to the London Session Open as price
lifts above the VAH, then retests (see our previous post above)
2) Notice that price retests twice. This setup is preferred by professionals
and is known as a "2nd Entry". It is considered a high probability entry
3) Look lower on that chart and notice that the "Skew" is positive. For our
system, this is confirmation, and we take the trade which has a historical
win rate of about 70%
4) The stoploss is about 3 pts, the profit target is +10. In this case the profit target
is hit first. We were trading 6 contracts, taking 3 off at +5, exiting 2 more at
at +10, leaving 1 to run, with a larger target of +20

Good luck
 

Attachments

  • Jan 15 London.PNG
    Jan 15 London.PNG
    117.2 KB · Views: 15
Last edited:
Our Weekend Pre-Market Preparation begins with evaluation of Pending Economic
Reports

1) This week's list begins Monday (US holiday Martin Luther King) and the initial focus is on
China (GDP).
2) From that point of departure, Institutions then look at "Services CPI" because these reports
(especially if revised) have the potential to activate "Sell Algos" that will put a cap on the
upward "drift" of the market. For those serious about trading with an edge, we suggest
you read this post carefully. We base our scenarios on the following assumptions

REPORTS

China Economic News/Monday

China GDP (Monday): This report influences global growth sentiment and commodity-linked assets (like the AUD and NZD currencies), with its impact on the S&P 500 futures largely absorbed before the Tuesday morning bell in New York. While we acknowledge that it CAN be significant, based on
what we know AT THIS TIME, it is not expected to have a big impact on the NY Session. We will update after the report is released.

NY Session Open/Tuesday

The Eurozone CPI report, will be released Tuesday morning. While the US Markets are closed Monday, the S&P 500 futures will trade in the overnight session and react to the news in real time. By Tuesday's NY open, much of the market's initial reaction to the China data will likely be priced in, though residual volatility may remain. It is this "residual volatility" that we want to trade. Again updates to our scenarios are likely.

Institutional Expectation

The market is currently pricing in potential Fed rate cuts later in the year, and any inflation data (even from the Eurozone) that challenges this narrative creates potentially negative response for the S&P 500 futures, thus the emphasis on China GDP and Eurozone CPI

The release on Tuesday is the final reading for December, with initial estimates suggesting a return to "target" levels. These are the currently
available "consensus" opinions.
  • Headline CPI: Expected to hold steady at 2.0% to 2.1% year-over-year.
  • Core CPI: Forecasted around 2.2% to 2.3%, as service-sector price pressures remain more persistent than headline energy and food costs.
  • 2026 Outlook: The ECB and other major institutions (OECD, IMF) project an average annual inflation rate of approximately 1.9% for 2026.
Important Note

Institutional desks currently view SERVICES PRICE GROWTH as the primary obstacle to a definitive end to the inflation cycle.
We will be monitoring Services CPI carefully because any deviation from recent numbers (3.4-3.5%) WILL activate ALGOS (on the sell side)
For institutional traders tracking services-specific inflation as a gauge for underlying price stickiness, there are two distinct releases to watch:

The first is, Eurozone final data this week, then the U.S. January report next month.
A detailed breakdown of services inflation for the Euro area is scheduled for release Monday, January 19, 2026 (with full final data typically processed by desks at the Tuesday, January 20 open).
  • Context: While the "Flash" estimate on January 7 provided a preliminary services inflation figure of 3.4% (down from 3.5% in November), the release on JAN 19th/20th IS EXPECTED TO PROVIDE CONFIRMATION.
  • Significance: Services remains the stickiest component of Eurozone inflation, and any upward revision in the final report would be viewed as hawkish by institutional desks
Also Important;

INSTITUTIONS WILL BE CLOSELY WATCHING the PCE Price Index on Thursday, January 22, 2026. This report includes the "Supercore" inflation measure (services ex housing and energy). THIS is currently the Federal Reserve's preferred metric for evaluating wage-related inflation pressures.

Final Summary/Upcoming Releases
  • January 19/20, 2026: Final Eurozone HICP (Full services breakdown).
  • January 22, 2026: U.S. PCE Price Index (Supercore services data).
  • February 11, 2026: U.S. January CPI (Services less energy services).

Bottom line for Professional Traders

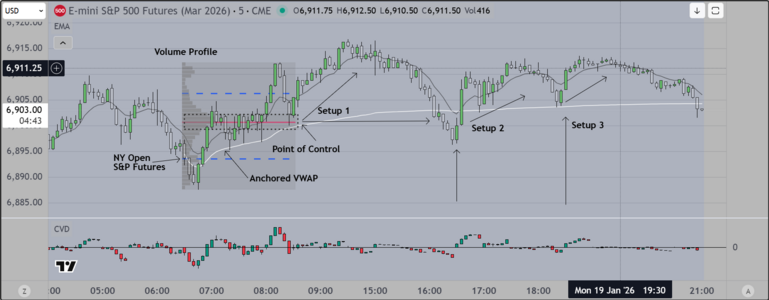
For this week, our Scenarios are shown below in order of preference.

SCENARIO 1

Professional traders will treat upward revisions in services inflation as a signal that "supercore" inflation remains problematic. Because services are heavily influenced by labor costs, stickiness here suggests that wage-price spirals are not fully extinguished, potentially delaying the next wave of global monetary easing. This creates a "valuation ceiling" for the S&P 500, especially as the index trades near logical resistance levels like 7,000. The
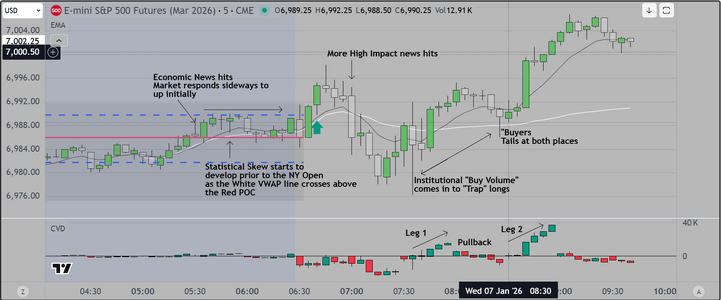
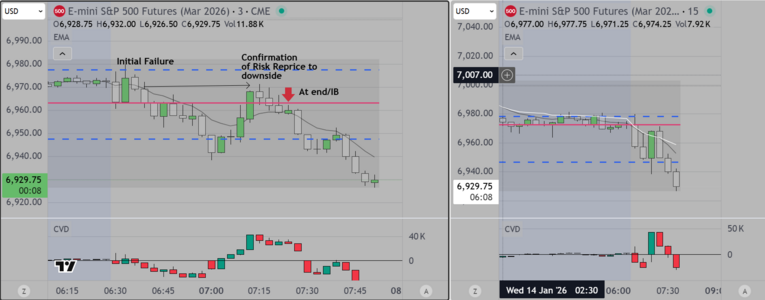
"expected" scenarios are a) a break to the upside, followed by a failure reversal lower, trapping buyers (trapping buy volume), OR if the news
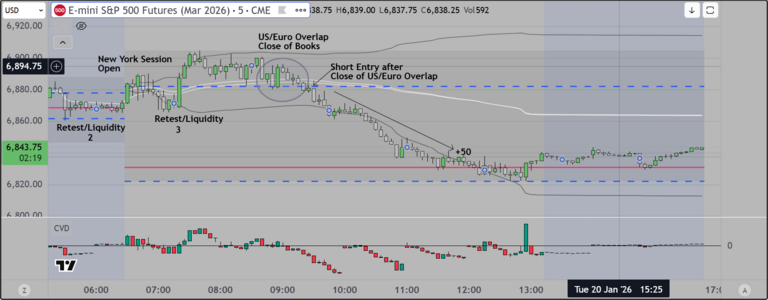
is significant, a trend day to the downside, in which case we would identify the "give up" bar and "go with", meaning we would get short and hold
looking for a logical exit at about +50 pts. This could occur Monday, but is more likely Tuesday or Wednesday

SCENARIO 2

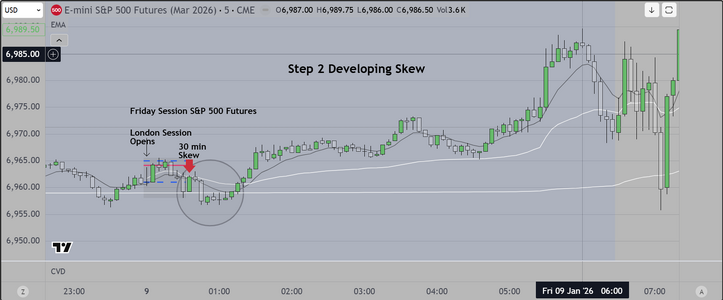
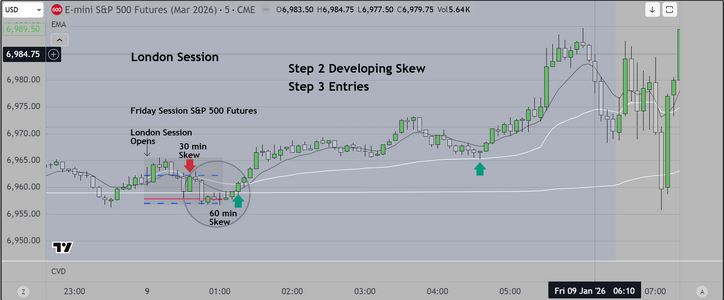
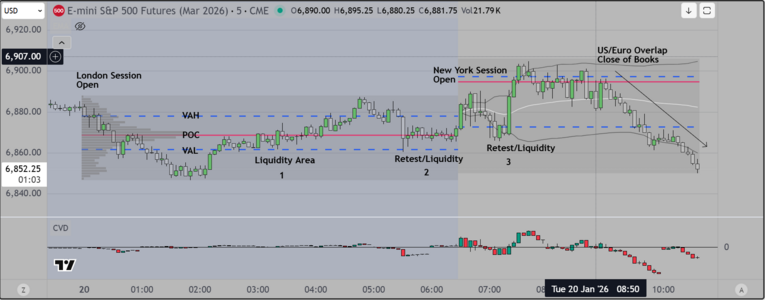
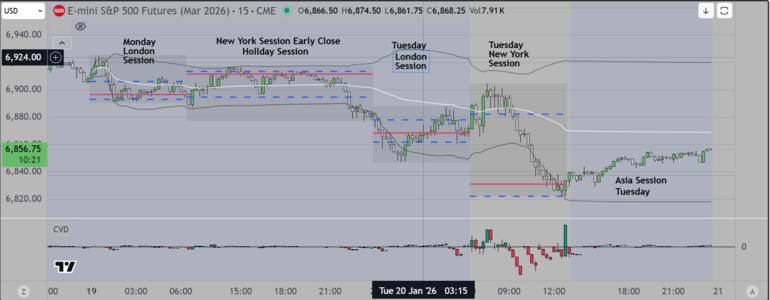
If there are no upward revisions, markets will start "neutral" on Tuesday and that would be apparent by monitoring the Monday London Session.
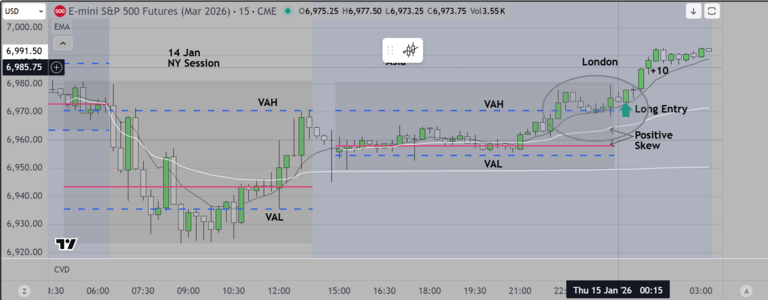
For this scenario, the market sweeps lower during the early going (London), then reverses at the end of the US/Euro Overlap, trapping shorts and reversing to the upside to retest 7,000. The "Tell" would be early trading range, followed by a false break to the downside, and then the reversal we mentioned


Good luck


Last edited:
Hello London & EuroZone Traders

Here is a markup chart showing several possible trades, that could be anticipated in the context of a US Bank Holiday
where the S&P 500 is trading during "Normal" hours (about 2:30pm London Local Time).

The important things to notice are as follows

1) We use a combination of Anchored VWAP and Anchored Volume Profile. Specifically, we use a simple technique
which involves monitoring how price acts, when it is tested at a price point known as the POC (point of control)
2) In this instance, when price tests the POC, it moves higher, and that tells us that buy algos have been triggered by
the test
3) From this point forward, because it is a holiday, we can anticipate that a specific type of trade is likely to be successful
and so we wait, for price to re-test, and we enter again (and again as shown on the chart).

These are very high probability trades, known in the industry as "layups" (a pro basketball term, meaning a shot that is taken
very close to the basket, that is easy to make).

Good luck
 

Attachments

  • MLK Session Trades.PNG
    MLK Session Trades.PNG
    115.2 KB · Views: 10
Good Afternoon London/Euro Zone Traders

Since the engagement and questions have been almost non-existent
we will no longer be detailing our logic on this site

We will attach our markup and it shows the basics
We start with Anchored VWAP & Volume Profile
We monitor only during our standard IB, and during that time
the observations create a framework for selective (time based) entries
(we look for one or two high value entries based on the first 30 minutes of data)
We do not enter unless we see setups that (historically) have approximately 70% hit rate.
Why? because the first 30 to as much as 60 minutes are discovery, THEN the institutional
algos are activated based on order flow. If you have enough experience, you can see this
as the time ticks down (CVD helps because it shows volume, preceding price movement
usually by one candle). If you know what to look for it becomes a matter of staying away
from weak entries, not putting yourself in a financial hole early, and being selective about
when (and how much) risk you accept.

Good luck
 

Attachments

  • Tues 20 Jan.PNG
    Tues 20 Jan.PNG
    72.3 KB · Views: 8
And here is our last Markup for today 20 Jan

We show the previous (London) session of the S&P 500 Futures, framing it with Volume Profile
and we mark the areas of liquidity, where weak lows exist. We don't want to give the impression that
Institutions "defend" at specific prices to move the market higher. That is NOT how this works. Price tests
an area where inventory is staged and can still be transacted by buyers (also called a "weak low"). This area
is re-visited until the inventory is equalized and resting orders are activated, which creates the fuel to move the
market higher each time. Sellers are weak, and cannot move the market lower. That becomes clear by the 2nd
"Re-Test" of the liquidity area. I marked the "weak lows" thinking that some of you might see what I am talking about.

It should become obvious that there is a pattern of behavior that can be identified. Once you identify the first "move"
then it is (relatively) easy to see the next one developing as price re-tests that same area. Today you had several
opportunities to enter long, THEN at the end of the US/Euro Overlap, everyone took profits.

Good luck
 

Attachments

  • Jan 20 Mid-Day.PNG
    Jan 20 Mid-Day.PNG
    100.1 KB · Views: 8
Interested readers should scroll up four (4) posts, where we provide Scenarios for this session
Look at Scenario 1, where we suggest that a final trade setup would probably result in +50 pts

Here is the chart showing the short entry at the end of the US/Euro Overlap, good for +50
coincidence? I leave that to others to decide.
 

Attachments

  • Final Trade Setup Jan 20.PNG
    Final Trade Setup Jan 20.PNG
    120.2 KB · Views: 8
Hello London & Euro Traders
It is about 7:40am in the City

As some readers may remember, we LiveStream and we show our
trades based on a TradingView screen, that uses two charts

Our Charts

1) Weekly view, using 15 min candles. Price action framed by Anchored VWAP
and Anchored Volume Profile
2) Single Session View, using either 5 min or 3 min candles, and (again) Anchored
VWAP and Volume Profile

Institutional Logic

We use the Weekly Chart to identify "Regime" and to determine who is has been in control
and/or which side may be "trapped. We also identify acceptance or rejection of Value.
In addition, we use CVD (Cumulative Value Delta) to confirm (as much as one can) directional bias.
Readers of previous posts can also see the impact of Economic Policy on US and World Financial Markets
and we show readers how to create tradeable "Scenarios" based on the impact of these reports.

Bottom Line

Basically we trade (only) at specific times during a session, and we look for opportunities based
on the relationship between the White Line (VWAP) and the Red Line (Volume Profile), which changes
(its dynamic) throughout the session. We were shown how to do this by a brilliant institutional trader
and it changed everything for us.

Our Future Plans

We have a couple of "projects" going on now. 1) we may (haven't made a final decision yet) continue
to trade live and concurrently teach a small group of retail traders, and 2) We are working with OneUp Trader
to see what the experience is like, for retail traders trying to obtain funding in order to create a sustainable business model.
Time permitting (and that's a big "if") we intend to continue and provide updates on this website.
We encourage readers to start here, and then read the previous posts. Its your quickest route to obtaining a summary of
what we do.

Good luck
 

Attachments

  • 15 Min Weekly Framework.PNG
    15 Min Weekly Framework.PNG
    113.2 KB · Views: 7
Last edited:
Good Afternoon London
Wednesday is often a "Gift Day" for professionals
This is because of the orientation toward discovery on Monday
followed by "Migration" of Value (higher or lower) on Tuesday
Once that is sorted, Wednesday is a natural "Followup" trade
and is (relatively) easy to spot (for those with experience.)

One early trade, and now we wait for the US/Euro Overlap to complete

Good Luck
 

Attachments

  • NY Session Jan 21.PNG
    NY Session Jan 21.PNG
    122.1 KB · Views: 8
This follow up chart shows two (2) important elements
of professional trade.

1) The first is attributed to Brian Shannon (Thank you Brian)
for his work on the concept of "Anchored VWAP" and more importantly
"The Pinch"

2) The second is the relationship of the White Line (Anchored VWAP) to the Red Line (Anchored
Volume Profile "Point of Control"). Specifically as the distance between these
changes (widens or narrows) it signals a statistical skew higher of lower and that
creates "edge", if you know how to read it.

3) Execution is straightforward. A stoploss is placed on the other side of the line,
the trade is entered (in this case long), then you hold, managing risk while evaluating
the strength of each successive candle.

Good luck
 

Attachments

  • Trading the Pinch.PNG
    Trading the Pinch.PNG
    119 KB · Views: 7
Back
Top