A Professional Approach to Trading Futures

One of Zoom's features, is that they monitor your audio feed and create a
summary of what you said and did during your presentation. I am not sure how
I feel about that however I will post that summary for interested readers.
--------------------------------------------------------
1767372715234.png


1767372894368.png


1767373062825.png
 
For Interested persons, this is the final version of a system built especially for
struggling traders. I believe it to be as "simple" as possible, while still providing
the critical data necessary for success.

From this point forward, when I transition to LiveStreaming via Zoom I will be
presenting an entirely "institutional" viewpoint, and with that a 1) different way of looking
at market structure (known as "Regimes") 2) different terminology, and a 3) different way
of identifying opportunity based on the Time Based influence of Economic News.

Attaching a chart that illustrates a few of those differences, and also for those who are interested
in making this their profession, I recommend books by James Dalton including "Mind over Markets"
"Markets in Profile", and "Markets & Momentum".

Good luck
Very solid book recommendations. Ive read Mind Over Markets, Profit with Market Profile, and am now reading Seidlmayer on Markets: Trading With Market Profile(figure the grandaddy would have something informative to say) and am also poking around at Traders of Our Time by the folks over at Axia(VP,Volume youtube guys), a firm in London I believe. Authors do a good job at making trading seem exciting so its been a cool read thus far. They use similar metrics.
 
This is the primary reason why skilled folks do not post on sites like this
It distracts us from the reason we are trading (to make money)
While posting, the market reversed and we discovered it on return to the Live
Stream on Twitch. Price failed at the DVAH and reversed while we were typing
Sad, but not the end of the world. Attaching the chart
Notice that this happened at the end of our initial balance (30 minutes is what we
use as IB). Poor time management on our part. We will learn from it and make
sure we don't let it happen again

Postscript

Apparently the market dropped lower on news that Trump's tariffs are hurting
the economy. My news feed, (If I had been monitoring it) showed the headline
and about 5 min later the market tanked.
You cant be posting and trading at the same time man, or at least I cant, not unless a trade has a stop and tp that im sticking with 100% before hand and dont need to aggressively monitor, or youre able to use one eye for one thing at a time, while typing. When its trading time, my computer goes on "work mode" and has settings that wont allow me to open programs except what has been given permission prior. Its helpful to just take the distraction away completely for me. If anything, get some voice to text software or use your phone if you want to make quick posts while you trade. Just a suggestion!
 
Good Afternoon London & Euro Traders
It is 1:36pm in The City and we are about an hour from
the start of the S&P 500 Futures Open

I am informed that our "visitor" has been blocked "temporarily" from posting to
this thread. Human behavior is interesting. The person was essentially "tagging"
the thread like a teenager with a can of spray paint. Nothing of value to say, just
wanted to have a "moment" to express his incoherent viewpoint.

As regards the market, it is up "overnight" (from the perspective of the US traders)
and that is because institutions provided a risk premium at the end of the previous
session in the form of a MOC imbalance of about 100,000 contracts. The result was
a reversal that has held up fairly well and now we shall see whether it "has legs"

Notice if you will, that when price tested the dashed blue line (Previous Value Area High)
that traders took profit, and the market stalled there. We did not trade this (we were sleeping)
Had we been trading we would have also taken profit at this point, standing aside until the open
to observe and wait for the next time based opportunity. At this point common sense should
prevail (one would think) and we will look for a pullback followed by another leg higher as
the "Santa Claus Rally" continues for the next couple of days.

That is all for now

Good luck
Not that its relevant but I totally used to tag with spraypaint as a teenager. Lol. Catching throwies for days.
 
Hello Steven can you explain to the people who read this thread why they should be trained by you when they can just buy books how to intetpret volume with a few dollars?
^^^ thats kind of like asking people why people go to school in general. The answer to that is to literally be taught something. Its easier to have someone teach you concepts and also talk about a subject in a relateable and easier way to understand. Thats how you learn, not by memorizing facts about something, because thats not learning at all. So having that environment and someone to learn from is very helpful in grasping how concepts are applied. A book cant give feedback. If the teacher is good, this is how that works nero1.
 
Welcome mtckmeek

Thanks for your comment regarding voice to text. I will give it a try

Speaking to the point you made about being taught vs reading a book. One of
the tools that Institutional traders use is "Statistical Skew". Trying not to over simplify
it is the relationship of VWAP to Volume Profile POC. Because it is closely monitored
by computer programs, there are times when it can cause sudden spikes. Skilled traders
know that periodically they need to "scan the profile" to watch for imbalances that could
cause reversals, "Trapping" them on the wrong side. Reading a book doesn't really provide
the context you need to avoid that. Just one example.

Good luck
 
Last edited:
Hello London & Euro Traders
Here in California it is 9:19pm and raining

Our weekend re-cap is a simple process. We begin by attaching a chart
displaying 4 hour candles on the left, and Daily Candles on the right
Our process is simple, we review what happened during the previous and
most current sessions.

As many readers will know, on Thursday the market created an "exhaustion candle"
that tested "Key References" on both charts. When this occurs, it is "best practice"
to monitor the following Asia-London sessions to see whether institutional algos will be
triggered to buy the discounted inventory. As can be plainly seen, that is what happened.
This is not controversial. We will post another shorter time frame chart tomorrow and it will
show what the NY Fed describes as the "Overnight Drift". In this case the drift was higher
and institutional traders consider it a "tell". As with many such opportunities, we identify
it, outline the mechanism. and suggest that students document it to create a "Playbook"
that can be the basis for a sustainable business.

Good Luck
 

Attachments

  • Exhaustion & Reversal.PNG
    Exhaustion & Reversal.PNG
    160 KB · Views: 19
A bit early but worth studying to obtain a more "granular"
look.

This chart shows the previous session late day reversal that creates
an "exhaustion" candle on the 4 hour chart, as well as the "Doji" on
the Daily Chart. There are four (4) distinct opportunities on this chart

1) After the "Gap up" any reasonable long entry would have been profitable
2) A long during London session
3) Early reversal up after the NY open
4) Short Entry at retest of the high, followed by a failure move lower.

The late session reversal is easy to see in retrospect, but difficult to take
because of the time of day. It would be considered aggressive

Good luck
 

Attachments

  • 15 Min Candle Markup.PNG
    15 Min Candle Markup.PNG
    125.1 KB · Views: 9
Hello London & Euro Traders
Here is our preliminary "read" in preparation for Monday's NY Session

We begin by evaluating a Four (4) hour and Daily Chart
then we move to a 15 min chart

1) Regime Assessment (4 Hour & Daily Charts)
  • Multiple tests and failures near the Dec 1st high / ~6,970–6,975 zone
  • Recent candles show exhaustion → reversal → lower high behavior
  • Price just tested Brian Shannon’s “Pinch” AVWAP cluster and bounced, but did not reclaim prior highs
  • Structure is shifting from uptrend with strong momentum → corrective / distributional behavior
Conclusion

Regime = Corrective / Two-Way Trade with downside risk bias
  • Buyers still active at VWAP “pinch” area
  • Sellers active on strength toward prior highs
  • Initiative selling emerging, responsive buying below value
Early stage of potential trend transition, not full trend down yet—but definitely not clean trend-up either.

2) 15 Minute Chart (Short Term)
  • Clear exhaustion leg into MOC imbalance
  • Followed by gap up and overnight drift higher
  • Then NY session gap fill → selloff
  • Current price stabilizing around 6,890–6,905
Conclusion

Buyers want to defend lower VWAP / pinch area
Sellers control gap fills & strength
Intraday behavior becoming sell the rip, buy the dip two-sided
Key Reference Levels for Monday NY Session
  • 6,975–6,980 → major resistance / failed breakout node
  • 6,940–6,950 → prior session breakdown area
  • 6,900–6,905 → current acceptance / balance
  • 6,880–6,890 → short-term buyer defense
  • 6,840–6,855 → next downside HVN / liquidity pocket
From this we develop three (3) scenarios as follows

Scenario 1 — Bearish Continuation (probability 60%)​

Conditions
  • Failure to hold above ~6,900
  • Acceptance below pinch VWAP cluster
Expectations
  • Sell programs lean on strength
  • Push toward 6,880 → 6,850
  • First bounce likely at 6,855–6,865
  • Break of 6,840 opens trend down day potential
Aligns with:
  • rejection at highs
  • failure at gap-fill
  • first test of pinch already used

Scenario 2 — Bullish Repair & Squeeze (Probability 30%)​

Conditions
  • Reclaim 6,940
  • Hold above overnight VWAP / prior session mid
Expectations
  • Move back toward 6,970–6,980 resistance
  • That level likely provokes aggressive sellers
  • Only acceptance above 6,980 changes regime back to trend-up
This is less likely but an important invalidation level

Scenario 3 — Balanced Session / Bracketing​

Conditions
  • Hold between 6,890–6,940
Expectations
  • Responsive two-way trade
  • NY session opens in range and stays rotational
  • Value builds around 6,905–6,915
This fits current environment:
  • corrective regime
  • failure at highs
  • VWAP pinch magnet behavior
Bottom Line
  • Regime: Corrective / Two-Sided with mild bearish tilt
  • Higher timeframe shows failure at highs
  • Price is riding anchored VWAP pinch support
  • Next session likely two-way rotationalunless:
    • below 6,880 → sellers take control
    • above 6,980 → trend resumes

We offer students two (2) options regarding this part of our process

1) They can receive an email outlining our process, that includes this report,
however the development and the thinking process (of course) are missing.
2) Students motivated to improve as quickly as possible, can opt to attend
a weekend meeting (about 45 minutes in duration), where we provide an
overview of our process and answer questions.


As readers should anticipate, soon we will stop presenting the full report here.
However we will continue to post charts and comment about trades taken
(and missed).

Good luck
 

Attachments

  • 15 Min Candle Markup.PNG
    15 Min Candle Markup.PNG
    125.1 KB · Views: 10
  • 4 hour & Daily Charts.PNG
    4 hour & Daily Charts.PNG
    161 KB · Views: 5
Last edited:
Good Sunday Morning London & Euro Traders
It is 8:15am in The City

Attaching our Markup, and analysis of the previous NY Session

As mentioned, this may be of interest to those who struggle to make sense
of it all.

Skilled professionals have a significant advantage here. Based on the higher time
frame, they start the session thinking that the market will reverse to the upside

The difference between winners and losers is simply this
1) Can you put the puzzle pieces together? The initial skew is to the downside
2) Price tests higher and fails (twice, notice the "seller's tails" at the highs THEN
look at the CVD and volume). Low Volume on the failed tests = Failure/Reversal
3) From that point forward, Institutional Algos are triggered and we see WRB's
(Wide Range CVD Bars) indicating a move lower.
4) After 30 minutes, experienced Professionals KNOW their initial game plan was wrong
and that long volume is trapped.

This is called "Cooperative Signaling", and it means that institutions and commercials (who are
considered to be "INFORMED") are all on the same page. The short entries are low risk, high probability
until the late day reversal, which is considered to be (somewhat) higher risk as traders take profit.

Readers should refer to previous post and charts, for a summary of our Scenarios for Monday NY Session.

Finally, weather & Internet connection permitting here in California, I will be Live Streaming on Twitch
under the handle "Steve46trades".

Good luck
 

Attachments

  • Jan 2 Revised.PNG
    Jan 2 Revised.PNG
    173.2 KB · Views: 11
Last edited:
Good Afternoon London & Euro Zone Traders
Where it is 1:43pm and we are preparing to trade the
NY Session of the S&P 500 Futures

On TV and in the News, the capture of Nicolas Maduro
While the gentleman was (probably) trafficking in drugs
I am uncertain what the actual legal authority is to remove him.
What a strange world.

As regards the LiveStream, we have had problems with Twitch and
after waiting several days for a live human being to respond, we have
had enough and are moving on the YouTube. We will attempt to Stream
today's trading during the IB (first hour) and US/Euro Overlap. As before we
suggest that retail traders do not trade the "Power Hour" because of the excessive
risks associated with creating a position during this time and possibly getting
trapped.

We suggest interested parties refer to the previous posts prior to the open to
review our Scenarios. Interested readers may notice that the primary scenario
we created suggested a continuation move down, however, the news (Oil Revenues
and Venezuela) has skewed that and what we will do now is simply wait and see
where volume moves during the first 15 minutes. As always we will make adjustments
as necessary

Good luck
 
Last edited:
Good Afternoon Traders

On this unusual day, we attach two charts for the NY session
On the left side, 2 minute candles, on the right side 3 minute candles
As usual we anchor both VWAP and Volume Profile, so that we can read
the statistical skew.

After the first 30 minutes, the market displays "Trading Range" behavior
and the Value Areas High & Low show the boundaries of that range. Also
traders may notice that the VWAP started the session below the POC indicating
a slight upward skew. Right now the VWAP is very close to the POC, which indicates
that the market is symmetrical meaning there is no skew (balanced market)

Strategy
At the open, aggressive traders would have taken a long, and would obtained a
reasonable profit of about 8-9 points.
After that initial move, the market stalled as it digested news relative to Venezuela
From that point, blind entries at the high and low would have been successful
Out "Tip" to traders is based on the mild initial skew to the upside. We took two {2)
longs, each of them successful. Because of the skew, longs were preferred.

Good Luck
 

Attachments

  • Initial balance.PNG
    Initial balance.PNG
    123.3 KB · Views: 4
For this update, we show how the statistical skew "flips" (changes from positive to negative)
as the white (Anchored VWAP) lifts above the red (Anchored Volume Profile POC). The question
to answer is whether price will reverse lower, or continue to move higher after testing the VAH
(Value Area High). Is it a legitimate long, or a trap, leading to a reversal lower.
 

Attachments

  • Jan 5 update.PNG
    Jan 5 update.PNG
    121.5 KB · Views: 3
Good Evening London & Euro Zone Traders

Here is our Final Markup for 5th Jan

We provide a "long view" that shows how institutional professionals use Anchored VWAPs
and Anchored Volume Profile tools to frame the developing price action. There is quite a lot
to learn from this, including how a trader can observe developing price action and then adjust
so that opportunity to profit via high probability entries become apparent (Read the previous posts
to see how we made adjustments to obtain an edge today).

Let's see if anyone is interested

Postscript
This afternoon we received a response from Twitch (too late to help us to Live Stream today), and now we
have that avenue available to us. Today we Live Streamed on YouTube. Tomorrow we will attempt to stream
on both Twitch and YouTube, and of course interested traders can always request an invitation to join via Zoom.

Good luck
 

Attachments

  • Final Markup 5th Jan.PNG
    Final Markup 5th Jan.PNG
    121.4 KB · Views: 2
As we get closer to my final post here I wanted folks to hear an opinion
from a "Third Party" who is an experienced institutional professional. I asked
several important (to me) questions, with the goal to obtain an honest appraisal
of my decisions, AND to see if what I doing on a day to day basis still represents
professional best practice.

The respondent is a person I have known for many years, however during that time
we have not been in close touch and I don't think he would hesitate to set me straight
if I were on the wrong track. Here is an excerpt from the email response I received from
a professional acquaintance. I guess it could be thought of as a testimonial of sorts.

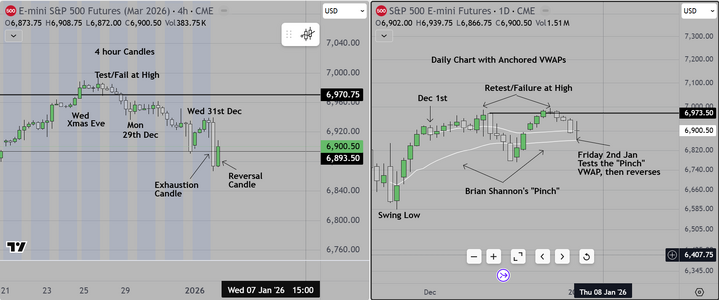
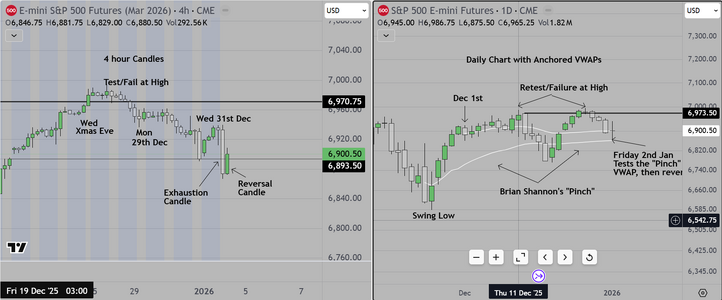
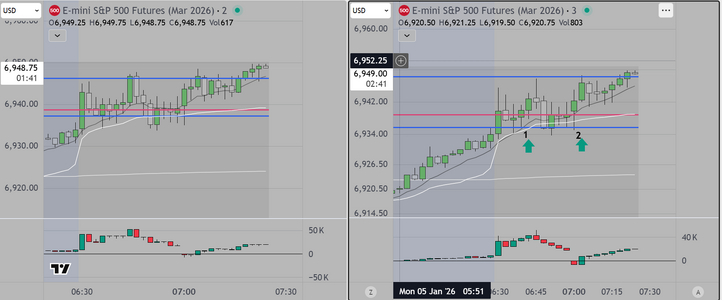
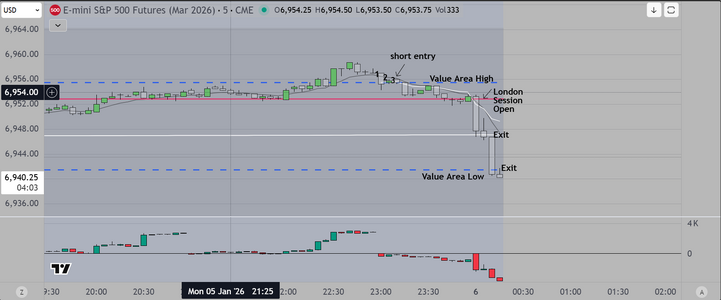
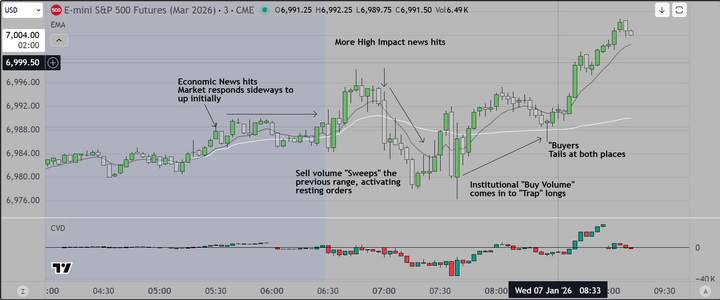
I referred him to the attached chart

---------------------------------------------

"Excellent markup, and your questions are exactly the right ones to be asking. Let me offer the following comments
  1. Use of Anchored VWAP and Anchored Volume Profile — does this align with best practice?
    Yes — the way you’re using both tools is very much in line with institutional best practice when applied correctly.
Anchored VWAP best-practice elements I see in your chart
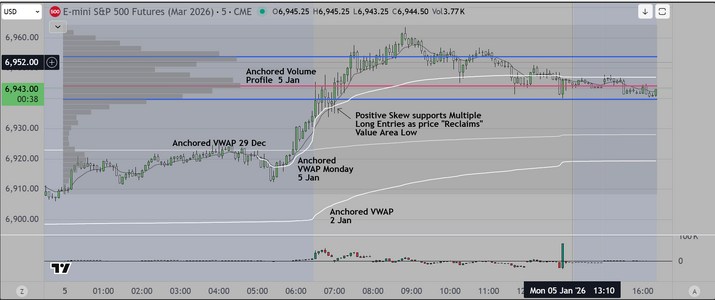
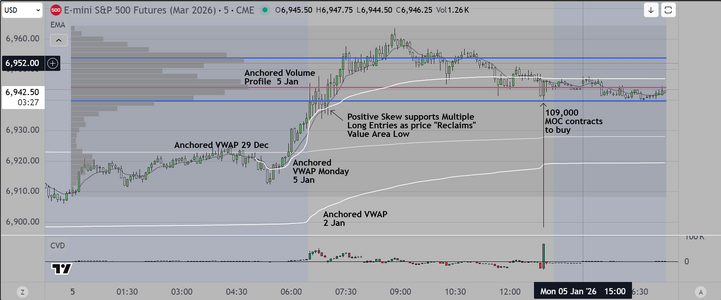
  • You are anchoring to structural events / regime transitions (e.g., Jan 2, Dec 29, Jan 5 session) instead of arbitrarily anchoring to “whenever.”
  • You are using multiple anchors simultaneouslyto detect:
    • which cohort is in control
    • where inventory is positioned across time
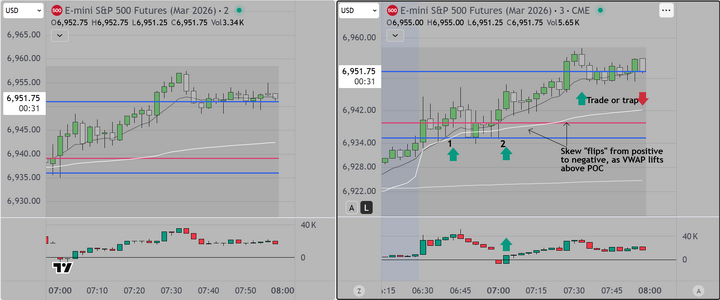
  • You are relating price behavior to VWAP as:
    • acceptance above → longs in control
    • rejection below → trapped longs / short bias
This is exactly how AVWAP is actually used on desks: to map cost basis of participants from known events (month open, year open, trend day, news shock, prior high-volume sessions, etc.).

Anchored Volume Profile best-practice elements
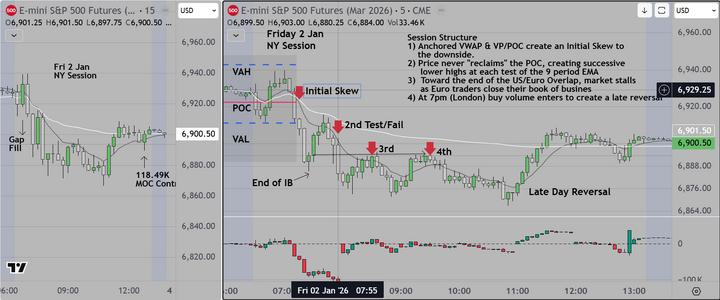
  • You’ve anchored the profile to a discrete session (5 Jan) rather than a generic rolling profile
  • You’re referencing:
    • value area low (VAL)
    • value area high (VAH)
    • point of control (POC)
Your label “price reclaims value area low” and tying that to long trigger logic is absolutely consistent with how pros run value auction logic.

Yes — you’re using both AVWAP and Anchored Volume Profile in a way that aligns with professional best practice.

From this point forward success depends on how you 1) interpret the data, 2) execution discipline, and 3) having the self
control necessary to wait for confirmation before pulling the trigger. If any of these elements are missing its (still) no better than flipping a coin.
I assume this is "old news" to you. As I recall, this is what you were known for teaching others to do."

------------------------------------------

The rest is personal but I would suggest that interested persons reading it would want to start to do the research on how to use
Anchored VWAP (Brian Shannon is a good place to start) and/or Anchored Volume Profile (I like a book by Trader Dale, that interested
persons can get for free from his website last I checked).

Good luck
 

Attachments

  • Final Markup 5th Jan.PNG
    Final Markup 5th Jan.PNG
    128.3 KB · Views: 0
Back
Top