Hello Readers
I have time tonight (I am located in California/US) to provide another example of
the preparation that I teach student traders to embrace as follows
----------------------------------
Friday (Tomorrow, Jan 23) Key Releases
- Flash Services & Manufacturing PMI — early marker of economic activity (9:45 AM ET)
Macro Implications
- Thurday's Core PCE & jobless claims that meet or beat expectations reinforced a backdrop of sticky but controlled inflation — keeping the Fed on hold into late Jan and potentially into early Q1 (already priced in by markets) .
- Friday's PMI figures have the potential to extend today’s trend if above consensus — bulls will take this as growth confirmation.
Macro Tailwinds
- Relief in geopolitical risk (tariff tensions easing) has already boosted sentiment and equities this session, lowering volatility and supporting equity risk appetite .
Directional Bias = Bullish
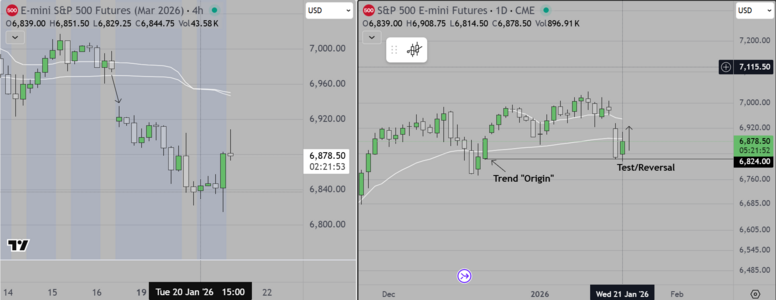
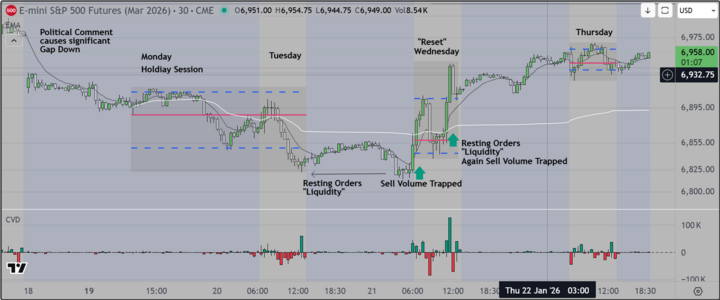
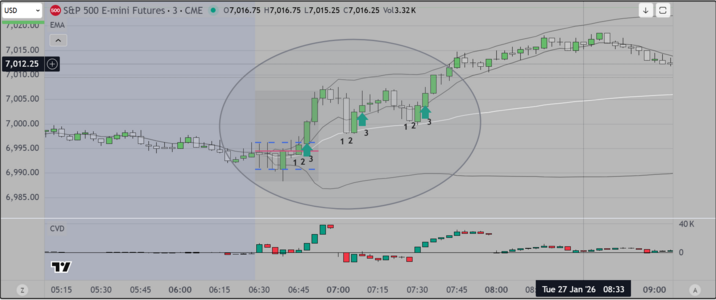
- The reversal from trapped sellers and subsequent accumulation suggests lower tail support and a structural pivot higher.
- Micro structure shows higher lows and range extension above low-timeframe resistance, signaling continuation if volume/participation confirms.
Scenarios
Scenario 1 Bullish Continuation/Trend Resumption
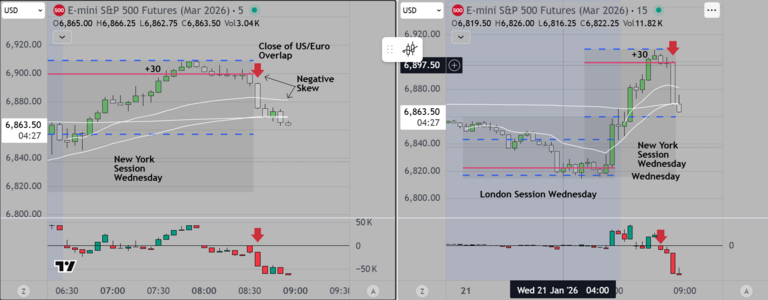
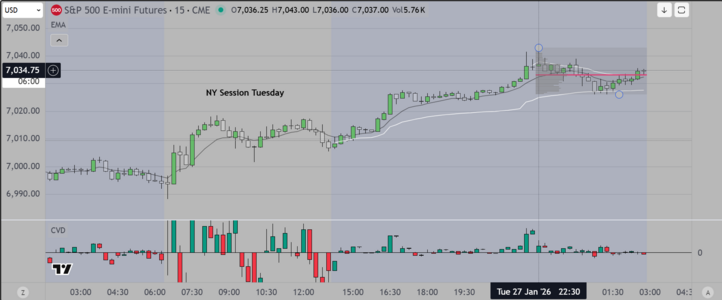
- Thursday's releases meet or modestly beat expectations → bullish sentiment persists. Liquidity remains above recent range lows, fueling extension into tomorrow’s New York session.
- Technical structure supports marginal higher highs, particularly if the market holds above Wednesday’s pivot and short-term EMAs.
Scenario 2 Volatility Reversion
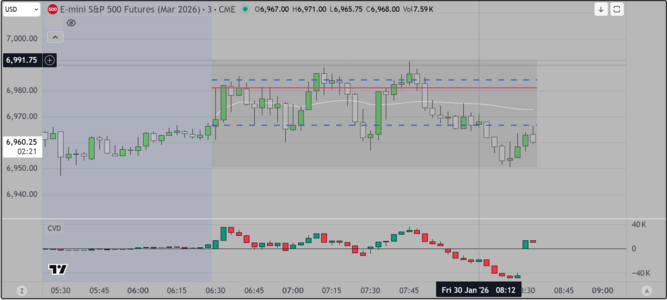
- If data severely underperforms or surprises to the downside, expect a pullback to prior support (range lows) before re-accumulation — volatility will compress into range boundaries and potentially retest demand nodes.
Risk Management
- Key support levels to defend (for continuation):
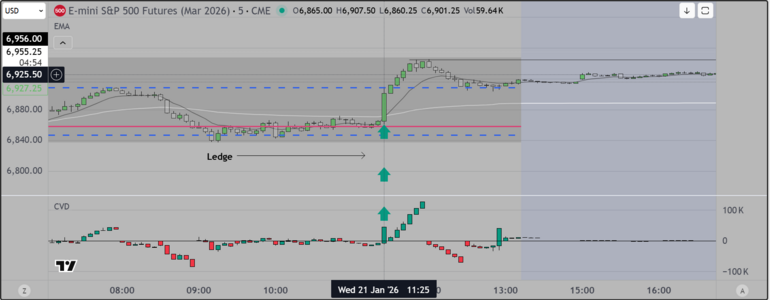
• Prior lows from range bottom seen on 5-min chart
• Wednesday pivot and early Thursday micro lows
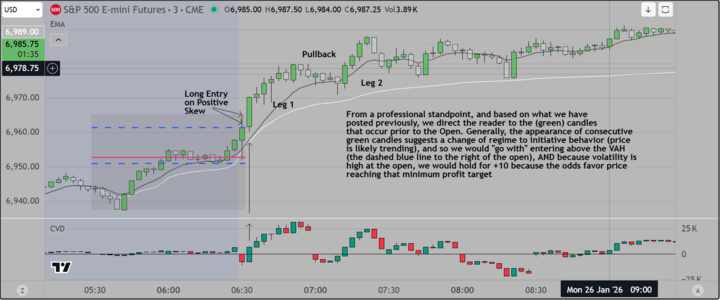
Entry/Exit Lens
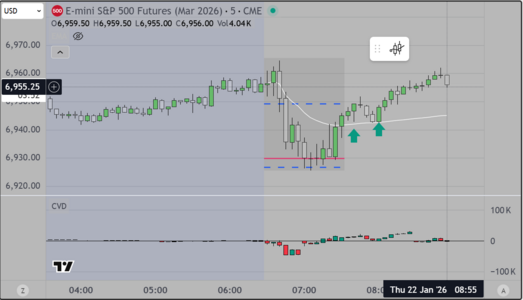
- Long entries on shallow pullbacks to structural support / liquidity confluence (EMA + prior daily range support) with tight stops below micro-structure lows.
- Gradual sell/hedge into Friday PMI if surprises materially above expectations.
Economic Report Release Schedule
PMI (Services & Manufacturing) —
9:45 AM ET
Both the
Services PMI and
Manufacturing PMI are set to print at 9:45 AM ET and will be the first look at business activity for the month. These are
flash/S&P Global PMIs and are market-moving indicators of economic momentum.
Consensus
Services PMI: ~52.9 (previous ~52.5) — expansion above 50 signals continued services growth.
Manufacturing PMI: ~51.9 (previous ~51.8) — expansion in manufacturing as well, albeit modest.
If at or above consensus, (results above
50.0) will indicate ongoing expansion in private sector activity, this could support "risk-on" sentiment (especially equities) especially early during the New York session. A surprise (less than expected) would likely trigger a reversal during the first hour.
For interested readers, THIS is how a professional prepares. We obtain as much information as possible and distill it down
to tradeable Scenarios. Then we adapt and adjust as the Session (in our case the NY session of the S&P Futures) opens
Good luck