I figure since it is recommended to have a trade journal, that I should start here. I have a small account where I trade eurusd only. Greed and lack of patience is my problem. I want to make money, but I have to lower my expectations regarding percentage gains from month to month, and avoiding trying to get too much out of the market swings.
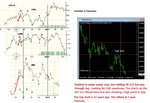
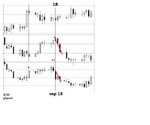
I use cycle analysis and price alerts on "alertfx.com" to look for trade opportunities.
I use cycle analysis and price alerts on "alertfx.com" to look for trade opportunities.