You are using an out of date browser. It may not display this or other websites correctly.
You should upgrade or use an alternative browser.
You should upgrade or use an alternative browser.
FetteredChinos
Veteren member
- Messages
- 3,897
- Likes
- 40
ranges are inversely proportional to direction, though the correlation is weak.
average range since jan 2003 onwards has been 113 points
funnily enough, you can build a trading strat just using ranges. if todays range > previous range, go long, and vice versa.
only marginally profitable, but it does go to show that constrictions in range tend to precede up moves.
down days have greater ranges, if i recall.
more stats to follow
FC
FetteredChinos
Veteren member
- Messages
- 3,897
- Likes
- 40
and here we go.. difference is only marginal
Average of range
up down Total
DOWN 166.3
UP 159.9
Grand Total 163.1
Average of range
up down Total
DOWN 166.3
UP 159.9
Grand Total 163.1
FetteredChinos
Veteren member
- Messages
- 3,897
- Likes
- 40
hmmm, now this is interesting..
Average of total
day Total
Monday 78.9
Tuesday 70.8
Wednesday 68.6
Thursday 72.9
Friday 72.2
Grand Total 72.6
these numbers measure the average amount of points that a day deviates from the previous high/low.
eg, if today broke yesterday's low by 5 points, and also broke yesterday's high by 75 points, then it scores 80.
if it only breaks the high by 20, is scores 20.
therefore a higher number implies more trendiness.
lo and behold, wednesday is the least trendy according to this, and mondays the trendiest.
i guess it must be the fundamental news that occurs over the weekend..
interesting..
FC
FetteredChinos
Veteren member
- Messages
- 3,897
- Likes
- 40
jmreeve said:another simple way to measure trendiness is AbsVal(C-O) / (H -L)
Just measures how much of the days range is included between the open and close so is a measure
of intraday trend. Using this might give different result.
hmm, my open data is a bit wonky, but using close-prev close we get this..
Average of trendiness
day Total
Monday 0.513
Tuesday 0.508
Wednesday 0.486
Thursday 0.505
Friday 0.517
Grand Total 0.506
wednesdays still underperform, mondays still trendier..
wednesdays still underperform, mondays still trendier..
Hmmm, I wish I could find the thread now where I got the stats regarding trending days. It was probably one of Chartman's intra day threads and would have been from months ago now.
What tools do you use to do these calculations?
FetteredChinos
Veteren member
- Messages
- 3,897
- Likes
- 40
daily OHLC data from downloadquotes.com (ie pretty reliable)
and excel pivot tables to average them all up for me.
FC
and excel pivot tables to average them all up for me.
FC
jmreeve
Well-known member
- Messages
- 432
- Likes
- 13
hmm, my open data is a bit wonky, but using close-prev close we get this..
Average of trendiness
day Total
Monday 0.513
Tuesday 0.508
Wednesday 0.486
Thursday 0.505
Friday 0.517
Grand Total 0.506
Using the close to close won't give a measure of trendiness so I would be careful about drawing conclusions from these figures.
FetteredChinos
Veteren member
- Messages
- 3,897
- Likes
- 40
well im not sure that any differences are statistically significant anyway! 🙂
was just an intellectual exercise, really.
FC
was just an intellectual exercise, really.
FC
Trading Shed
Member
- Messages
- 62
- Likes
- 1
Racer
Senior member
- Messages
- 2,666
- Likes
- 30
NEW YORK (AP) -- Kirk Kerkorian's Tracinda Corp. is offering to pay about $870 million for a nearly 5 percent stake in General Motors Corp. in a deal that would boost the billionaire investor's stake in the world's biggest automaker to nearly 9 percent.
Tracinda said in a statement Wednesday that it was offering to buy 28 million shares, or 4.95 percent, of GM stock at $31 a share in cash, an 11.6 percent premium over GM's closing stock price on Tuesday.
It said the proposed purchase was for investment purposes only.
GM shares jumped $1.83, or 6.6 percent, to $29.60 in premarket activity. A message seeking comment was left with GM.
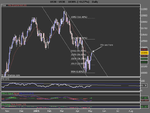
I think that with only minimal "interpreting" the same can perhaps be said of the 3-hour chart.Trading Shed said:Any comments?
Attachments
FetteredChinos
Veteren member
- Messages
- 3,897
- Likes
- 40
user said:Great chance of playing with 10260 AGAIN
Dow or FTSE?
Similar threads
- Replies
- 1
- Views
- 4K
- Replies
- 1
- Views
- 5K