Where is the Dow and Mothers heading in 2006?

Isn't there a gap up near 10,950? Who knows, that one might be filled first.

Bigbusiness, you're not wrong - there's also a small one left unfilled just under the year high at 11060ish...

it could be addressed yet.....!
 
Last night:-
Likely consolidation or reversal tomorrow could provide the target for the next move
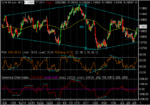
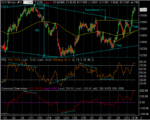
Well, maybe, but a look at the emerging bigger picture on the 60min charts shows that a potentially very potent pattern is taking shape…

A diamond top…? – generally known as a high probability reversal pattern to the downside, and the 400 height of the consolidation hints at a similar target from the breakpoint….

If it plays out as anticipated, we should see yesterday’s rally continue shortly to touch the top resistance line at around 950, where it should reverse and fall back eventually to touch the lower support line for the third time pending a break south towards the target….

Purely speculative comment of course which could be compromised by news/events, but I note that the pattern has also been identified as negative by Ed Downs on his Signalwatch t/a site. He quite rightly describes yesterday’s upside as a mere “reaction rally”.
 

Attachments

  • 09-02-06.gif
    09-02-06.gif
    22.8 KB · Views: 243
tradesmart,

I too think that the diamond pattern could signal a downturn, am currently 50% short of dow waiting to get near 950 for the rest. The main problem would be when would the pattern be invalidated, what if it reaches 950 and then goes on to challenge the 11,050 top, at what point would you consider the pattern invalidated?
 
at what point would you consider the pattern invalidated?

Mark - it's roared right up to the top resistance trendline at 950 and stopped just like we suspected it would - there's a small gap to filled at about 960ish YM which it might address, but I'd start to get suspicious if it started to break north beyond that.....

It could fool us and go for a proper 'double-top' yet....

Regards

edit 18.22:-
there's a small gap to filled at about 960ish YM which it might address
It surged up to 970 just to fill that small gap, and has now dropped away 35 points - sometimes it's predictable.... ;)
 
Last edited:
It looks as though the 30 year Treasury bond auction has gone well. We could well see a rotation out of stocks now.
 
Well, looks like the success of the 30 year T bond auction combined with Fed President Moskow comments about wage inflation has stopped that rally in its tracks. Got to say that spurt up to 10950, in the middle of lunch hour, looked a bit technical. I managed to get short within 10 points of that top. Sometimes you get these things right.

The only real positive thing that I can see to justify getting much higher is the falling oil price. That, however, can change very rapidly.
 
Good shorting, Maca. For me personally, 925. I think the price was excellent value for money all in all. I'll be holding this short for a few days and see how it pans out.
 
Got to say that spurt up to 10950, in the middle of lunch hour, looked a bit technical..
Yes MacB - Cyborgs playing around with algorithms I’d say, but it created a nice lower high to sell from, and I was happy to jump on board myself….

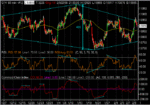
The ‘diamond top’ plan seems to be coming together nicely, with just a small overshoot of the falling top resistance line to fill that small gap centred on 960…

All being well, the price should percolate down over the next few sessions to test the rising support line in the 800 area…
 

Attachments

  • 09-02-06a.gif
    09-02-06a.gif
    23.1 KB · Views: 210
Yesterday:-
All being well, the price should percolate down over the next few sessions

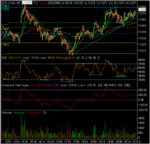
It was looking good for the first hour or so, with a nice tank to 835, but the Naz hit the 2240 baseline support of the bear triangle it’s making and bounced big-time to the 61.8% fib level of its fall from yesterdays peak.

These indices are apparently algorithmically linked, and they invariably move in lockstep although not % pro-rata, so the Dow bounced with the Naz .

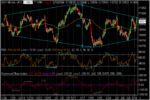
A slight adjustment to the top resistance line of the ‘Diamond Top’ setup and we’re still in it, and I suspect we'll go down from here to test the lower line....

There will be a lot more volatility/whipsawing while the index is ‘winding-up’ within the diamond boundaries until there is a breakout which could produce a big trending move imho

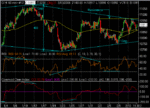
The 5 min chart shows that the midday consolidation gave the clue for the closing high – also the pivot points working well.

Moved my stop to, 'Ray stevens'.

RB – I suspect that you’ll be better off with a trailing stop for a while – it’s going to be whipsawing as the range tightens until the breakout comes..... ;)
 

Attachments

  • 10-02-06.gif
    10-02-06.gif
    24.2 KB · Views: 212
  • 10-02-06a.gif
    10-02-06a.gif
    18.5 KB · Views: 198
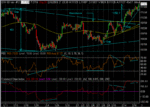
Still within the confines of the diamond shape, but is that a bull triangle forming below the oft tested 960ish resistance line?

If the bulls can push through 960, it would almost assure a test of the recent highs above 11000 and even beyond imho, bearing in mind the 400 height of the consolidation… :cool:
 

Attachments

  • 13-02-06.gif
    13-02-06.gif
    20.1 KB · Views: 204
Last edited:
Last Night:-
If the bulls can push through 960, it would almost assure a test of the recent highs above 11000…
No sooner said than…… ;)

However, tomorrow:-
Ben Bernanke Speaks! Wednesday - Feb 15, 2006
10:00 AM ET : Federal Reserve Chairman Ben Bernanke to give semiannual monetary policy testimony to House Financial Services Committee, in Washington .
Maybe it’s just as simple as – if they like what he say’s it’ll go up; if they don’t it’ll go down…

We’re in double-top territory now anyway, so maybe we can anticipate a pull-back from resistance….
 

Attachments

  • 14-02-06.gif
    14-02-06.gif
    25.1 KB · Views: 251
Well, I guess today’s performance comes under the heading ‘consolidation at the highs’…..a ‘V’ shaped day…

A cautious start, but right on the 10.00est magic moment when Ben’s pontifications hit the wires, a huge gap up above the 11055 pivot and right on to hit the precise '84' number of the January top, followed by a gap fill ‘technical tank’ to the 11005 pivot line with the reversal point confirmed by RSI PD.

A slightly erratic climb back to the highs in the pm session, with RSI divergence and 9/16 (yellow/blue) period SMA’s confirming the demand and supply flows for scalping, and the 100EMA (orange) confirming the overall rising trend.

The yellow dashed lines at 23/47 registering the pre-market low/high also proving useful.

‘Round trip’ days such as today often suggest that a triangle or similar consolidation may be under construction, so the coming days will likely confirm whether this is a continuation or reversal pattern....
 

Attachments

  • 15-02-06.gif
    15-02-06.gif
    24.6 KB · Views: 206
Last night….
a triangle or similar consolidation may be under construction……
No need for that..! – onwards and upwards with minimal pullbacks seems to be the bull’s strategy…..!

Is the 400 prior consolidation height target at 11350 in the sights..?... :cool:
 

Attachments

  • 16-02-06.gif
    16-02-06.gif
    25.7 KB · Views: 162
Quite a nice 200 point run since the breakout from 10960 resistance and 11350 remains the speculative target, but the return trip price action over the last couple of sessions hints that the index may now be about to consolidate its gains before the next significant move emerges imho…
 

Attachments

  • 23-02-06.gif
    23-02-06.gif
    27.9 KB · Views: 183
Hmm,

Not sure about it going up much further without a significant pullback. Look at the daily and weekly charts - 3 peak ND. I'm expecting (hoping) a 600 point drop down to the base of the expanding triangle. Short at 11,100.
 
mombasa said:
Hmm,

Not sure about it going up much further without a significant pullback. Look at the daily and weekly charts - 3 peak ND. I'm expecting (hoping) a 600 point drop down to the base of the expanding triangle. Short at 11,100.

600 point drop? That would seem a bit extreme no?

I'd be happy with a 150 point drop, but even that seems unlikely any time soon.
 
pre-market today:-
the return trip price action over the last couple of sessions hints that the index may now be about to consolidate its gains before the next significant move emerges imho…

Not far out......

A whipsaw day and a clear 100 high triangle of indecision under construction.....and a great day for trading to gap fills.....

The 100 height insinuates a similar target from the breakpoint - I suspect down so you're in with a chance Mom.....!

But it could always take us by surprise and start the next leg up..... ;)
 

Attachments

  • 23-02-06a.gif
    23-02-06a.gif
    25.7 KB · Views: 207
Above:-
But it could always take us by surprise and start the next leg up.....
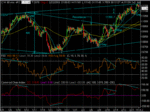
Always worth keeping an eye on what patterns the other indices are making when looking for clues to direction…..

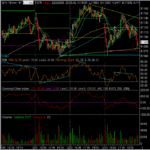
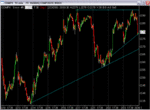
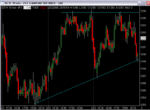
The Dow’s triangle above is symmetrical, but the Naz and S&P’s versions are markedly ascending against a well defined top resistance line….

Purely speculative comment and I’m not going to bet the farm on it, but I’ll be watching those resistance lines….. :cool:
 

Attachments

  • 24-02-06.gif
    24-02-06.gif
    23 KB · Views: 201
  • 24-02-06.gif
    24-02-06.gif
    21 KB · Views: 196
Top