You are using an out of date browser. It may not display this or other websites correctly.
You should upgrade or use an alternative browser.
You should upgrade or use an alternative browser.
Where is the Dow and Mothers heading in 2006?
- Thread starter tradesmart
- Start date
- Watchers 15
tradesmart
Experienced member
- Messages
- 1,286
- Likes
- 22
750ish is probably not so unrealistic at this point?
You could be right RB...!
Motorola Inc. lost 6 % of its market cap and ranked among the most heavily traded stocks in Thursday's extended trading session after the company's sales results missed analysts' consensus forecast.
The futures are sliding once again - anything could happen......
tradesmart
Experienced member
- Messages
- 1,286
- Likes
- 22
Rudeboy yesterday:-
Rudeboy this morning:-
Target hit -great calls Paul…!....... 😉
Very realistic in hindsight.......750ish is probably not so unrealistic at this point?
Rudeboy this morning:-
When i mentioned 750 as possible support, i didn't mean it as my target today.
Target hit -great calls Paul…!....... 😉
macbonzo
Well-known member
- Messages
- 292
- Likes
- 6
]
Looks like someone has been eating the bulls' porridge in huge quantities.
Not in the market either, but, I felt thing's changed after the INTC results and NYMEX not retreating from $65 on wednesday. Looks as if nobody wants to hold over the weekend.
Looks like someone has been eating the bulls' porridge in huge quantities.
Not in the market either, but, I felt thing's changed after the INTC results and NYMEX not retreating from $65 on wednesday. Looks as if nobody wants to hold over the weekend.
Last edited by a moderator:
tradesmart
Experienced member
- Messages
- 1,286
- Likes
- 22
Last night:-
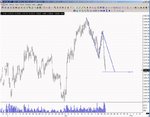
Yes – In hindsight a pretty obvious bear flag; fuelled by Osama/Oil and disappointing results from some of the worlds premier corporations….the clean break of the 10850 former support pivot providing a great entry point today…
Last nights 100 point high consolidation target reversed would have given a clue to the downside prospects for today – and even the bear flag target measured from the 11080ish high has been exceeded….very bearish……!
Over 200 down today - could that be just the beginning of the punishment….?!?
But there’s always another way of looking at it…..
Charlie Miller:-
this could easily morph into something else…..
Yes – In hindsight a pretty obvious bear flag; fuelled by Osama/Oil and disappointing results from some of the worlds premier corporations….the clean break of the 10850 former support pivot providing a great entry point today…
Last nights 100 point high consolidation target reversed would have given a clue to the downside prospects for today – and even the bear flag target measured from the 11080ish high has been exceeded….very bearish……!
Over 200 down today - could that be just the beginning of the punishment….?!?
But there’s always another way of looking at it…..
Charlie Miller:-
And there are three now – a handbrake turn and a higher low might be worth looking for next week…....strictly imho and maybe... 😉Per the discussion of gaps, I should have mentioned that gaps tend to get filled within 1-3 trading days.
Attachments
rossored
Senior member
- Messages
- 2,103
- Likes
- 56
In response to a number of reported posts and continued unwarranted aggressive behaviour, I have banned Rudeboy for a period of 7 days. He has had more than his fair share of warnings.
I will also post to this effect on the Banned Members Noticeboard.
I will also post to this effect on the Banned Members Noticeboard.
tradesmart
Experienced member
- Messages
- 1,286
- Likes
- 22
Not a lot of confidence to buy yet after last weeks heavy falls and a 100 high triangle in the making – the price still within the boundaries, but the overall tone seems bearish just now - the breakout will decide direction imho with a 100 point target from the breakpoint implied.
A determined break south could see 10500 in the sights…….
However, oil has baulked at $69/70 resistance again and maybe some decent company results could provoke a flash rally to the upside to fill a gap or two…
A determined break south could see 10500 in the sights…….
However, oil has baulked at $69/70 resistance again and maybe some decent company results could provoke a flash rally to the upside to fill a gap or two…
"This may be the start of a correction, said Harry Clark, chief executive of Clark Capitol Management. "I'm looking for a good decline to set up a good market buying opportunity later this year."
Attachments
Last edited:
tradesmart
Experienced member
- Messages
- 1,286
- Likes
- 22
Last night:-
Yesterdays triangle winding up to an extended sharp end before quite an explosive breakout north today for a while, but a swift reversal now giving the consolidation the appearance of a bear flag……sellers fading any attempted upside move (so far)…100 points in abeyance..!
Charlie Miller on yesterday’s volume:-
the breakout will decide direction imho with a 100 point target from the breakpoint implied.
Yesterdays triangle winding up to an extended sharp end before quite an explosive breakout north today for a while, but a swift reversal now giving the consolidation the appearance of a bear flag……sellers fading any attempted upside move (so far)…100 points in abeyance..!
Charlie Miller on yesterday’s volume:-
Don’t bet the farm on it ,but he often gets it right…...Volumes were up today. Although the COMPX volume was "normally high" for a Monday, the Dow Monday volume was the highest that it's been since Sept 2002. There are only a hand full of higher Monday volumes for the Dow. EVER!
The rollover anticipated by the lockstep chart should begin to (on average) level out, if it is to make its bottom pivot nominally on Friday.
Attachments
solentsurfer
Active member
- Messages
- 110
- Likes
- 3
So he's saying it's going down, or just waiting to Friday to go up?
BTW, what charts are you using.. look nice and clear.
BTW, what charts are you using.. look nice and clear.
tradesmart
Experienced member
- Messages
- 1,286
- Likes
- 22
I think Charlie is anticipating a fall from current levels – lets see what happens.. any speculative target so far in advance can fail of course. Charts are by SierraCharts…So he's saying it's going down, or just waiting to Friday to go up?
BTW, what charts are you using.. look nice and clear.
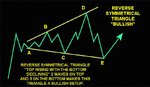
The bear flag formed over 3 days has broken south only to bounce off Monday’s critical lower support level. If this level holds tomorrow it could clearly prompt a bullish reversal to the upside to fill the gap at 10900…..support failure could see 10500ish….
The 60 min chart shows an expanding triangle….three touches on the bottom support line and a nice positive divergence on RSI reinforces the prospect of a possible break to the upside imho..
Attachments
Similar threads
- Replies
- 0
- Views
- 3K