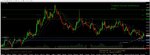
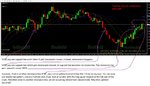
There is no arrogance from me but trading is not a lottery and its not based on pure luck. I am not betting here. Not testing the luck and not being arrogant. You are saying its MY mistake. What is my mistake? How could the following situation on attached graph for opening Short position of symbol USDNOK (at white arrow) be my mistake? All the rules of trading are saying: If resistance line is failed to be upward crossed by closing of GREEN candle and if next candle is going downward (preferable to wait so its fully closed and in red) then downtrend will continue: retracement (downward) from resistance line because it wasn't upward crossed.
How could this be my mistake? I am starting to believe that broker on purpose scammed me and moved the current market price into opposite direction comparing to my opened position (Short) just to make me loss. This is very unfair to me.
The broker has nothing to do with the outcome of your trading strategy - they just provide you access to the market. It is your mistake! Do you really think financial professionals make trading decisions by looking at candles? Your mistake is your approach to the market. The market doesn't operate with participants deriving trading strategies by looking at candles and adding yes\no rules to them. The market is reacting to economic and political driven news that affects investment decisions. So you might not have broken your trading rules but what you need to understand is the rules and strategy you are trying to apply is about as useful to making money as an ashtray on a motorbike.