What else to do to AVOID this?

I don't see any evidence for an uptrend in that chart. The candlestick you've pointed out has a high which lower than the last minor trend high - to me that just confirms a downtrend and if anything signals a short trade once the low of that candlestick is broken.

There are so many things wrong with your strategy, your entry points mean you can't set tight stops so the R:R is poor. Not that you even use stops - this is eventually going to end up in disaster for you.

If you want to continue your delusion that you are right and picking the right entries - so be it - but the majority of us are saying from experience that your strategy isn't going to work.
 
I don't see any evidence for an uptrend in that chart. The candlestick you've pointed out has a high which lower than the last minor trend high - to me that just confirms a downtrend

Talking about Daily EURAUD: The red candle (see white arrow) is the one where I opened my Uptrend position. At the time of opening Uptrend position, the candle wasn't fully formed yet, therefore there was nothing to rely on what the color will be (still talking about candle i am pointing at with white arrow). If you look at this same daily chart two candles behind (from the one with white arrow), you will see Inverter Hammer (green candle). This is uptrend primary pattern.
 
Talking about Daily EURAUD: The red candle (see white arrow) is the one where I opened my Uptrend position. At the time of opening Uptrend position, the candle wasn't fully formed yet, therefore there was nothing to rely on what the color will be (still talking about candle i am pointing at with white arrow). If you look at this same daily chart two candles behind (from the one with white arrow), you will see Inverter Hammer (green candle). This is uptrend primary pattern.

https://en.m.wikipedia.org/wiki/Inverted_hammer

You need to look more closely at your candlestick patterns.
 
Hi,

I am looking for your suggestion - what extra protections could I do, BEFORE entering into position, to avoid unwanted retracement into the opposite direction comparing to my opened trade. I am facing all the time this problem and result is wasting several months of waiting for the trend to go into correct direction matching my opened position. I am spending months by months where time could be invested elsewhere on different position. What I am doing is correct BUT I clearly need to do a lot of other work I am unaware of. Please if someone could help because of being additionally extremely worried due to negative Swap charges - they are rising (into negative = expense) day by day and trend just doesn't go where I it was going according to my analysis work so I could close position with at least zero profit to avoid the loss.

In order to ask for our suggestion, I obviously need to describe my strategy: it consist of Alligator indicator and Fractals indication:

UPTREND Position Opening: Trend of current green candle must go at least for minimum distance above the entire shape of valid ( * ) upward fractal but this green candle must fully form. Valid upward fractal must occur above alligator's TEETH line. The LIPS alligator's line must cross above both JAW and TEETH line for at least minimum distance above both. The angle of crossing doesn't matter. Additional situation that must also happen is that closure of green candle must be above all three alligator lines.

DOWNTREND Position Opening: Trend of current red candle must go at least for minimum distance below the entire shape of valid ( * ) downward fractal but this red candle must fully form. Valid downward fractal must occur below alligator's TEETH line. The LIPS alligator's line must cross below both JAW and TEETH line for at least minimum distance below both. The angle of crossing doesn't matter. Additional situation that must also happen is that closure of red candle must be below all three alligator lines.

* valid fractal is the one which is the closest to the said cross.

Besides this, I am doing three major part of work BEFORE entering position:

1. checking economic calendar. Assumption is the following: if relevant event occurs while i am in position or at least in first few hours after having position opened, then it could mean that result of event (forecast vs. actual) may cause trend to go into unwanted direction. To protect myself, I need to make sure there are no high impact economic events related to the symbol. Similar when trading stocks: to make sure there are no major meetings or news on relevant finance blogs websites about particular company.

2. analysis of support and resistance line. Obvious assumption is the following: if the support or resistance line is touched or even break out, without confirmation candle, then this could be a sign that trend will go into the opposite direction.

3. primary patterns such as bullish/bearish engulfing patterns, hammers, evening starts, dojis, etc. Assumption is the following: if such primary pattern occurs with confirmation candle then there is huge possibility that it is showing CORRECT direction of a trend. So i need to be careful there are no unwanted primary patterns near by showing opposite direction of a trend comparing to position i am considering to open.

**It just doesn't work!**

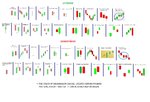
I am getting tired of situations as shown on THREE attached pictures. Note: manually drawn white arrow is pointed to show you approximately where/when i opened position. Even usage of classical indicators such as Stochastic Oscillator, RSI, CCI, don't solve the problem. Please see ATTACHED three files.

What else could I do to prevent all the time happening what is shown - occurrence of opposite trend? I am sure that all the work I am doing BEFORE entering into position is correct BUT i clearly need to do something else too and I am unaware of what else should be done? Hopefully someone will be able to assist, I simply won't be able to wait half year and more for every single position to be closed just to come to zero profit (covering negative swap) and avoid losing money.

Your assistance would be highly appreciated.

Haha the famous deep dip before the trend continuation gotta love that one..
Think of it this way, if the trend seems too obvious that everyone and their mama, your baby cousin and your dog can see it then you must think to yourself..'something is wrong here'

1) Notice that the trend is up
2)If the trend up is very strong then there must also be a strong retracement
3)Either catch it when the trend 1st begins or after the strong retracement to go long(Which is easier said then done) but must be patient, then enter the trend
 
Hi,

I am looking for your suggestion - what extra protections could I do, BEFORE entering into position, to avoid unwanted retracement into the opposite direction comparing to my opened trade. I am facing all the time this problem and result is wasting several months of waiting for the trend to go into correct direction matching my opened position. I am spending months by months where time could be invested elsewhere on different position. What I am doing is correct BUT I clearly need to do a lot of other work I am unaware of. Please if someone could help because of being additionally extremely worried due to negative Swap charges - they are rising (into negative = expense) day by day and trend just doesn't go where I it was going according to my analysis work so I could close position with at least zero profit to avoid the loss.

Your assistance would be highly appreciated.

hey there.............most people can call the trend ...but most people cant then get in and run it without stopping out

simple answer ?

wider stops .....or get that timing even better

welcome to trading :)

N
 
... This is uptrend primary pattern.

you dont know what youre talking about mate. i know youve read a book on candlesticks, watched a couple of videos or whatever but i suspect youd still be better off tossing a coin for long/short at your current level of understanding. dont take it personally, its just food for thought :)
 
  • Like
Reactions: FXX

Attachments

  • Primary Patterns.jpg
    Primary Patterns.jpg
    339.5 KB · Views: 197
An inverted hammer candlestick cannot indicate imminent price rise. Of course, if its high is exceeded by subsequent candlesticks, that would be a bullish indication.
 
In attachment I am uploading my collection of entire list of all PRIMARY patterns I created for myself. Comments, particularly for Inverted Hammer, would be appreciated.

Where are your indicators such as MACD, RSI and moving averages? Also there are thousands of patterns that you have missed.
 
Why are you using weekly chart? Even worse than daily I believe. The problem is that higher the time frame is, less dynamic you see on chart (less happenings). Therefore there is even less possibility to earn income from trading....


This only makes sense if you are consistently making profits already by short-term trading. The reality is that intra-day trading and long-term trading are not just the same game speeded up or slowed down.

Even if you are determined to maximise your trading opportunities and profits, taking fewer trades does not mean lower profits, as long as you have a higher win rate and larger positions. You are confusing busy with effective.
 
This is what I am seeing...

Your trading is built on the belief that if you see one of your signals - then that signal is an accurate prediction and you should trade it. You then proceed to trade without a stop until the prediction comes true (or your account goes bust - whichever comes first).

Here's what you have failed to grasp - these signals are not consistently accurate. They may have a accuracy greater than 50% (and I seriously doubt they are greater than 70%) but there will be a significant proportion where the signal does not predict future direction. Your buy and hold strategy then means you can't trade any more because your money is locked up maintaining losing positions until by random chance your positions go back into the money.

However if you are long USD and Russia declares war on America (slim chance but a possibility) then where does that leave your account?

Find a strategy that uses stops.
 
In attachment I am uploading my collection of entire list of all PRIMARY patterns I created for myself. Comments, particularly for Inverted Hammer, would be appreciated.

In your picture of an inverted hammer you will see that the open has gapped below the low of the previous candle and that the low of the inverted hammer is the low of the down trend so far. The thing you are calling an inverted hammer in your earlier post has none of these characteristics which form the rationale, such as it is, for considering the inverted hammer to be a potential reversal signal.

In my experience you can’t use such candlesticks patterns as reliable indicators, merely as reasons to make an assumption about direction with a quick bail out if the assumption doesn’t pan out. Certainly you shouldn’t sit there waiting days, weeks, months for price to “come right”. That way leads to disaster.
 
tomorton: yes, the bullish pattern (inverted hammer) is what i was referring to in post #22. Currently EURAUD is fortunately looking better, god knows for what time period, but i would like to discuss the torture I had to go through, while this uptrend ( ! ) position was in loss. As you see there was major downtrend after i entered uptrend position. The problem related to my question is: Inverted Hammer is PRIMARY pattern showing uptrend. It occurred on D1 chart two candles (two days) before i entered Uptrend position but then, even after Inverted Happen (indicating uptrend) the downtrend still happened. This is against what your friends tomorton on this forum are saying: to not only consider h4 but to work on d1 too. Even d1 showed uptrend according to Inverted Hammer (euraud). Why downtrend then?

pigbear: those what you listed, are indicators and not primary patterns. In my attachment to my post #27 i was showing only PRIMARY patterns. Not secondary ones. The only thing I may have missed is the basic (original) doji. This would be my answer to your comment when you said there are thousands of patterns I have missed. Those ''thousands'' are not primary ones.

Hoggums: yes I know you are saying nothing can be 100% reliable and i agree with you. Trying to investigate some D1 charts, even on other instruments and not just currency pairs. I see that dojis, even with confirmation candles, doesn't really prove that there will be trend reversal, even if everything is happening on resistance/support line assuming that trend will go in opposite direction. Example of what I am referring to is the following: Please open EURAUD chart (D1). Go to candle on day 5th February 2018. There is red doji. I would NOT define it as Evening Star primary pattern because its entire body should be higher. So I would define it as, just like I said, original doji. Next day, there is confirmation downtrend candle. Therefore downtrend should continue. Another reason for that is: It '''refused'' to upward cross ''quality'' resistance line. Therefore reversal should happen but it didn't. How about that? I believe the only way to comment this is to look at the chart, at same symbol (euraud), same time (d1), same day (5th February 2018).

barjon: the primary patterns are used along resistance/support strategies and along economic calendar as well as upper/lower trendlines. I believe resistance/support only is not enough. Proof of this is my comment to Hoggums. What you named as ''disaster'' is exactly what I am doing: Trying my best, wasting months, to NOT loss money and at the same time to not earn it. I have two examples of currently opened trades where i am doing this ''disaster'' and they are the following (i assume you may check the chart and your comment would be appreciated):

symbol: usdcnh
position direction: uptrend
entry price: 6.35675
entry date: 8th February 2018 at 13:11 London UK timezone
current swap: over NEGATIVE 90 eur

symbol: gbpchf
position direction: downtrend
entry price: 1.29103
entry date: 2nd March 2018 at 12:03 London UK timezone
current swap: over NEGATIVE 71 eur

Unfortunately for both my main goal is to NOT loss money (involving swap charges of course). I am much more worried for gbpchf rather than usdcnh. The reason is the following: When i zoom out (clicking on minus key on keyboard until it goes zooming out so maximum zoom out) on H4 usdcnh, the current ''happening'' is ALMOST at the bottom of entire chart. It just doesn't want to go high enough to cover my negative swap. My assumption is, since its max zoom out, that once it will start to go UP, this will be happening strongly nonstop without unwanted downtrend. Why? Because it has been at the bottom of chart H4 (usdcnh) for a very long time. Once sufficient uptrend will occur, it will probably be strong one so its worth to wait. Regarding gbpchf: I am extremely worried here and have no idea what to do. I doubt very much that trend will ever go so far that it would entirely cover negative swap charges. Why am still remaining in opened position on gbpchf then? I have no idea. Just don't want to loss...

So I assume that everyone's reply as ultimate answer to my main question ''what else to do to avoid this'' is to NOT use h4 only but also d1. I would appreciate if I could please get some more suggestions particularly when it comes to price action.

Additionally I am still repeating my sub-question in post #22 to Hoggums (same question in this current post to tomorton): inverted hammer not correctly showing uptrend (downtrend happened).

kalott: In your first link, Inverted Hammer looks pretty much the same to my.
 
Your friend

You didn’t comment on my view that you misidentified an inverted hammer?

You don’t seem to be appreciating that if price goes against you then the “signal” that you entered from is invalidated and no longer applies. The fact that price may finally go your way some way after you have been carrying heavy losses In no way means that the original entry signal was right. It just means that you’ve been lucky.

Unfortunately it often happens that price comes back and allows you to get out without heavy losses. That convinces people to hang on and wait but, sure as eggs are eggs, the time will come when price just keeps on going “wrong” when you finish up,at worst, with your account wiped out or, at best, seeing many weeks of hard earned gains wiped out.
 
You didn’t comment on my view that you misidentified an inverted hammer?

Kindly check post #27 where i showed all PRIMARY patterns. Check Inverted Hammer pattern. As you can see it has symbol '' *** '' and on same attachment is defined what this symbol means. Furthermore, please open chart EURAUD on D1. See candle on 30th May 2018. How can this green candle not be an Inverted Hammer (pattern showing uptrend)? Is the reason that closing of candle ( *1 ) on said attachment is not the same as closing of candle ( *2 ) on said day of said chart?

*1: here the closing is below previous candle's closing

*2: here closing of this green candle is above closing of previous candle (red). Actually closing of green candle is somewhere in the middle of previous candle's body.

Is this the reason why you said that I misidentified Inverted Hammer? If yes, does that mean there are two versions of Inverted Hammer?

What is the said primary pattern on said say then?

The previous candle low was lower than the “inverted hammer” low, thus the inverted hammer low was not the low of the downtrend at the time. Similarly there was not a significant gap opening with the opening of the “inverted hammer” about the same as the previous candles close. These two features represent the rationale behind the signal.

Lastly, the close of the “inverted hammer” was higher than the previous candles close ( not lower as you say).

where? in which parts of your post (which exact words) are you referring to my collection of primary patterns and in which parts of your post are you referring to chart? I apologize but without clearly defining the subject and its location what are you referring to, I have no way to understand what do you mean. Perhaps some graphical answer would also be appreciated but no need to if its too much time consuming for you.

Additionally, are you perhaps aware of any similar tool for MetaTrader 4 as this one:

https://www.mql5.com/en/market/product/9693

but with complete/entire list of strictly ONLY PRIMARY patterns and with alerts. In said tool, unfortunately, there are several primary patterns missing and some are included that shouldn't be there. Mainly due to financial reason i am unable to contact the developer to modify the tool according to my needs. Currently i don't have the budget to pay that.

I think something like such tool had Hoggums in his mind too...
 
Next day, there is confirmation downtrend candle. Therefore downtrend should continue. Another reason for that is: It '''refused'' to upward cross ''quality'' resistance line. Therefore reversal should happen but it didn't.

The bits I've highlighted are where you are going wrong.

Your statements are simply incorrect. you are implying that past price action influences future movement and that is not true - only sometimes it is.
 
Top