barjon
Legendary member
- Messages
- 10,752
- Likes
- 1,863
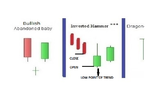
Here's the inverted hammer from your primary pattern list. Note that the open of the inverted hammer is a gap down from the close of the previous candle and that the inverted hammer is the low point of the downtrend. These are the two essential features that provide the rationale behind the pattern.
Now compare that to your so called inverted hammer in euraud. It has no significant downward opening gap and it is not the low point of the trend since the previous candle reached lower/
Now compare that to your so called inverted hammer in euraud. It has no significant downward opening gap and it is not the low point of the trend since the previous candle reached lower/