You are using an out of date browser. It may not display this or other websites correctly.
You should upgrade or use an alternative browser.
You should upgrade or use an alternative browser.
wackypete2
Legendary member
- Messages
- 10,211
- Likes
- 2,058
1168
Pat494
Legendary member
- Messages
- 14,614
- Likes
- 1,588
Thanks for telling me to turn my chart over Pat!
I am glad it is working for you. Spot on last week
:cheesy:
robster970
Guest Author
- Messages
- 4,567
- Likes
- 1,390
1135 for me this week.
robster970
Guest Author
- Messages
- 4,567
- Likes
- 1,390
They are net long about 10% according to COT for the SP contract - a slight change from net 11% long last week.
Pat494
Legendary member
- Messages
- 14,614
- Likes
- 1,588
I know you probably trade different time frames but I do really short ones of 3 minutes.
This leads me on to Target and Stop Loss if any. I have experimented with different ratios. I agree this is a very personal issue as to what you may feel comfortable with. I just hate it when I try and be clever and not have a stop and see it keep going the wrong way !
So what I am using at the moment is the ratio 2:2 which is about as good as suits me and my style.
Perhaps you would care to comment on yours ?
:smart:
isatrader
Senior member
- Messages
- 2,965
- Likes
- 136
I know you probably trade different time frames but I do really short ones of 3 minutes.
This leads me on to Target and Stop Loss if any. I have experimented with different ratios. I agree this is a very personal issue as to what you may feel comfortable with. I just hate it when I try and be clever and not have a stop and see it keep going the wrong way !
So what I am using at the moment is the ratio 2:2 which is about as good as suits me and my style.
Perhaps you would care to comment on yours ?
:smart:
I use the 200 day Average True Range (ATR) and include the spread for my max stop loss distance. But I'll generally try to put it closer depending on where the major support is. I find it easiest to use a 60 minute point & figure chart for this and put the stop where the P&F chart would give a sell signal.
Pat494
Legendary member
- Messages
- 14,614
- Likes
- 1,588
I use the 200 day Average True Range (ATR) and include the spread for my max stop loss distance. But I'll generally try to put it closer depending on where the major support is. I find it easiest to use a 60 minute point & figure chart for this and put the stop where the P&F chart would give a sell signal.
Interesting - I'll have a closer look.
Pat494
Legendary member
- Messages
- 14,614
- Likes
- 1,588
Interesting - I'll have a closer look.
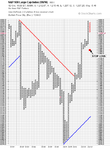
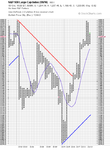
I tried a 15 ATR on the current 60 minute P&F chart
Has possibilities
Attachments
isatrader
Senior member
- Messages
- 2,965
- Likes
- 136
I tried a 15 ATR on the current 60 minute P&F chart
Has possibilities
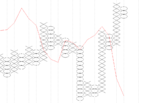
I'm not sure about applying the ATR to the point & figure chart, if you are doing something like that I find the Parabolic SAR works well for the stop position or even a simple moving average. I meant I use the ATR separately as a guide for the range and use a P&F sell signal for the stop position. So for example on the 2 point box size chart below the stop would be below the last consolidation, so below 1186. So if the todays 200 day ATR is 19.59 points, then the highest position I could go long would be up to around 1205.
If the current column of Os reversed back up into Xs then that would create a new minor base and so the stop would move up below that to the next double bottom sell position.
[EDIT 21:58] The P&F sell stop below 1186 held as we didn't get a double bottom sell signal, and it could now move up to below 1192 as a small consolidation has formed. So any break below 1192 would trigger it. I've personally put a sell order below the 1186 level to try and catch a breakout to the downside.
Attachments
Last edited:
Similar threads
- Replies
- 1K
- Views
- 193K
- Replies
- 908
- Views
- 140K
- Replies
- 989
- Views
- 142K